 TABLE OF CONTENTSchevron_left
CHARGEBACK REPORT & STATISTICS
The Year in Chargebacks
Introduction
Kount's The Year in Chargebacks report takes an in-depth look at payment disputes. The data provides unprecedented insight into why chargebacks happen, how to prevent and fight chargebacks more effectively, and what’s in store for the future.
At Kount, we believe data analysis is one of the most impactful elements of a successful chargeback management strategy. Data-driven decisions produce far better results than guesses and assumptions. The Year in Chargebacks report is designed to help you recognize the value of data analysis and the role it can play in chargeback management.
Ultimately, we want to help you create intelligent, effective strategies that will lead to a significant improvement to your bottom line.
We hope this resource is valuable to you!
The data in this study was collected from a subset of merchants who used Kount technology to manage chargebacks between January 1, 2021 and December 31, 2021. These merchants were chosen because they represented a broad spectrum of billing models, industries, transaction volumes, and dispute management styles.
Merchants in this study ranged from small startup businesses to large enterprise brands. In 2021, individual chargeback counts ranged from 23 disputes a year to 77,331. Annual sales ranged from $19,000 to $379,000,000.
The 2021 data was generated from 81 million transactions, 1.3 million chargebacks, 658,000 prevention alerts, and 206,000 order validation cases.
Kount's The Year in Chargebacks report is the first of its kind because it is data-driven analysis. All other industry reports that contain chargeback information are based on merchant surveys.
Data provides a more accurate explanation because it is factual, whereas surveys reflect opinions and assumptions. Therefore, The Year in Chargebacks report provides a truer representation of current chargeback trends.
Overview
What are the most important conclusions that can be drawn from The Year in Chargebacks?
INSIGHTS & RECOMMENDATIONS
Why does The Year in Chargebacks report show a decrease in year-over-year trends when other studies indicate chargeback risks are intensifying?
The difference is an ongoing effort to manage disputes.
Chargebacks are still a significant threat as this report’s 1.52% chargeback-to-transaction ratio indicates. If merchants didn’t make any effort at all to reduce risk, the data in The Year in Chargebacks would be much different.
However, the merchants in this study recognize the dangers that chargebacks pose to their business and have focused on reducing them.
Therefore, the drop in the chargeback-to-transaction ratio emphasizes the effectiveness and value of Kount's ongoing, proactive chargeback management efforts.
Recommendations
Merchants are encouraged to follow a comprehensive chargeback prevention strategy to reduce unnecessary revenue loss, costs, and penalties.
This should include a combination of pre-sale strategies (address verification service, card security codes, third-party vendors), post-sale tools (prevention alerts, order validation, RDR), and post-chargeback management initiatives.
Fighting chargebacks can be a difficult task. And because it isn’t always easy, a lot of merchants don’t even try to recover lost revenue. However, that can be a costly mistake.
In 2021, merchants who fought chargebacks experienced an average return on investment (ROI) of 914% — a 121% increase since 2020.
The data proves that, with the right evidence and the right response strategy, it pays to fight.
Recommendations
Merchants should create a strategy for fighting chargebacks that includes collecting necessary compelling evidence, setting fight rules to optimize ROI, customizing responses, and meeting submission deadlines. Technology can help ensure the highest win rates possible with the least amount of expenses.
In 2020, the COVID-19 pandemic had a significant impact on nearly all businesses in all industries in all regions of the world. Everything from inventory and shipping to customer service and refunds was affected.
And for some merchants, chargeback management strategies were impacted too. This was most evident in international marketplaces. In 2020, the chargeback-to-transaction ratio was unbearably high in many countries. In response, merchants were even more proactive in their fraud and chargeback management strategies in 2021.
Recommendations
The fluctuating year-over-year trends emphasize a noteworthy insight: evaluating risk on a country-by-country basis should be a dynamic process.
It’s normal for consumer preferences to vary from region to region and from year to year. But COVID-19 has forever changed ecommerce on a global scale. It altered behaviors in a way that couldn’t have been anticipated before nor predicted now.
Going forward, merchants need to rely heavily on data analysis. International expansion could easily become an unmanageable risk if it is based on hunches and guesses instead of educated decisions.
Since 2020, the COVID-19 pandemic altered chargeback management strategies for many merchants.
For example, common struggles included an influx in disputes, an inability to fight chargebacks before they expired, a lack of transparency regarding outcomes, and much more.
However, these challenges only affected certain merchants — primarily those who managed chargebacks manually.
Because the merchants included in this study had benefited from Kount's advanced technology and expert advice — some for more than six years — the results in The Year in Chargebacks are markedly different from what has been reported throughout the industry.
Kount's expertise and advanced chargeback management technology, combined with a significant increase in transaction volume, helped ensure the study’s downward trend in the chargeback-to-transaction ratio continued in 2021.
Positive chargeback management outcomes can’t negate the devastation that merchants faced. However, these small victories were a welcome relief for many during such a tumultuous time.
Recommendations
Merchants can use this unprecedented experience as an opportunity to reconsider their opinions about chargeback management.
For those who haven’t already accepted professional chargeback management help, now is the time. Proactively seeking assistance before chargebacks become a liability is key. Merchants can use technology, like Kount, to achieve better results with greater efficiency.
Ratio of Chargebacks to Transactions
Is there an accurate metric to gauge the impact of chargebacks? What is the best way to monitor trends?
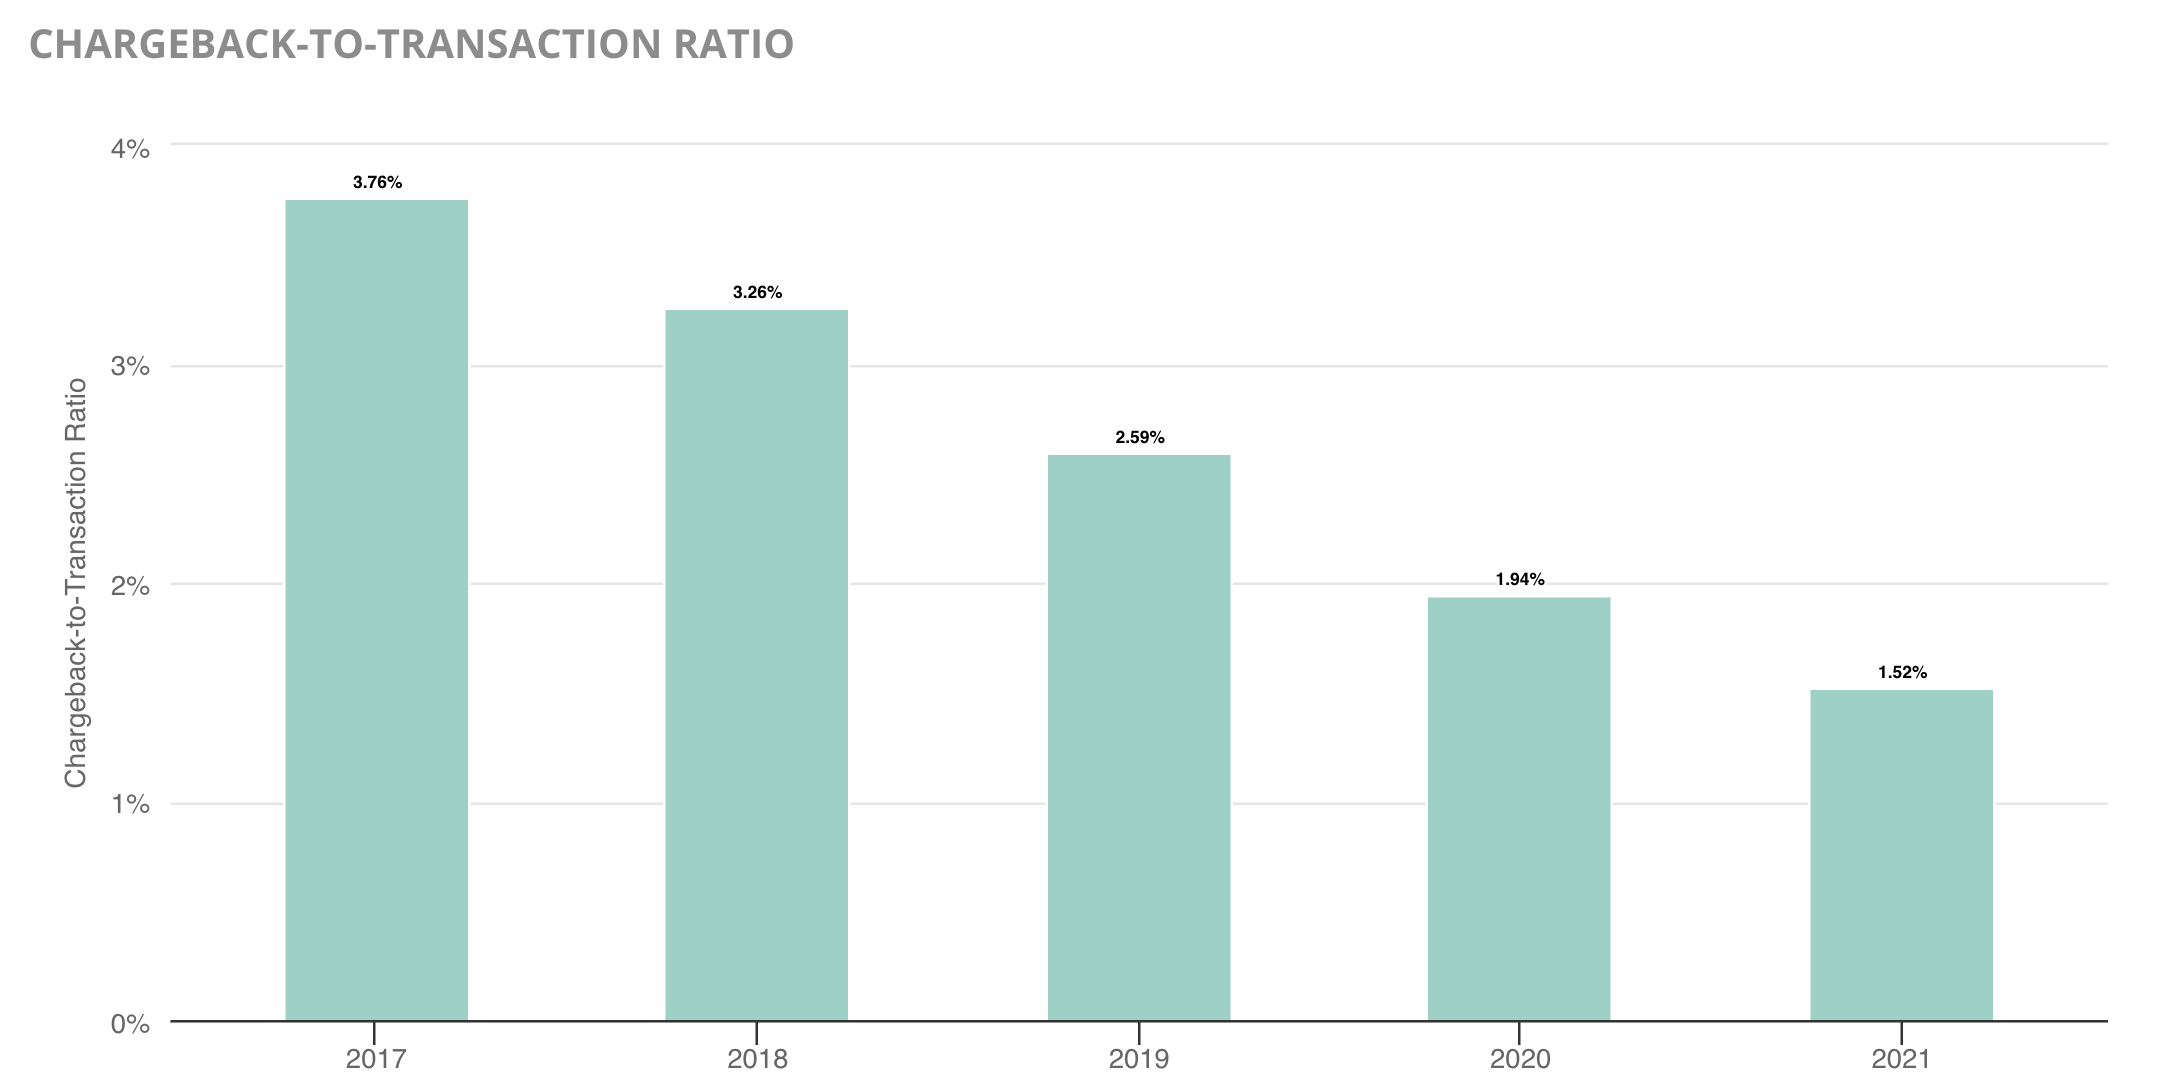
The most relevant and accurate insight comes from multi-dimensional analysis. It reduces the risk of assumptions drawn on incomplete data that can often happen without context. Therefore, one of the most helpful chargeback management metrics is the chargeback-to-transaction ratio — the percent of transactions that turn into chargebacks.
The study’s overall chargeback-to-transaction ratio dropped by 21.6% between 2020 and 2021. In total, the ratio has dropped 59.6% since 2017.
A drop in the overall chargeback-to-transaction ratio was driven by significant decreases in Visa® and Mastercard® chargebacks.
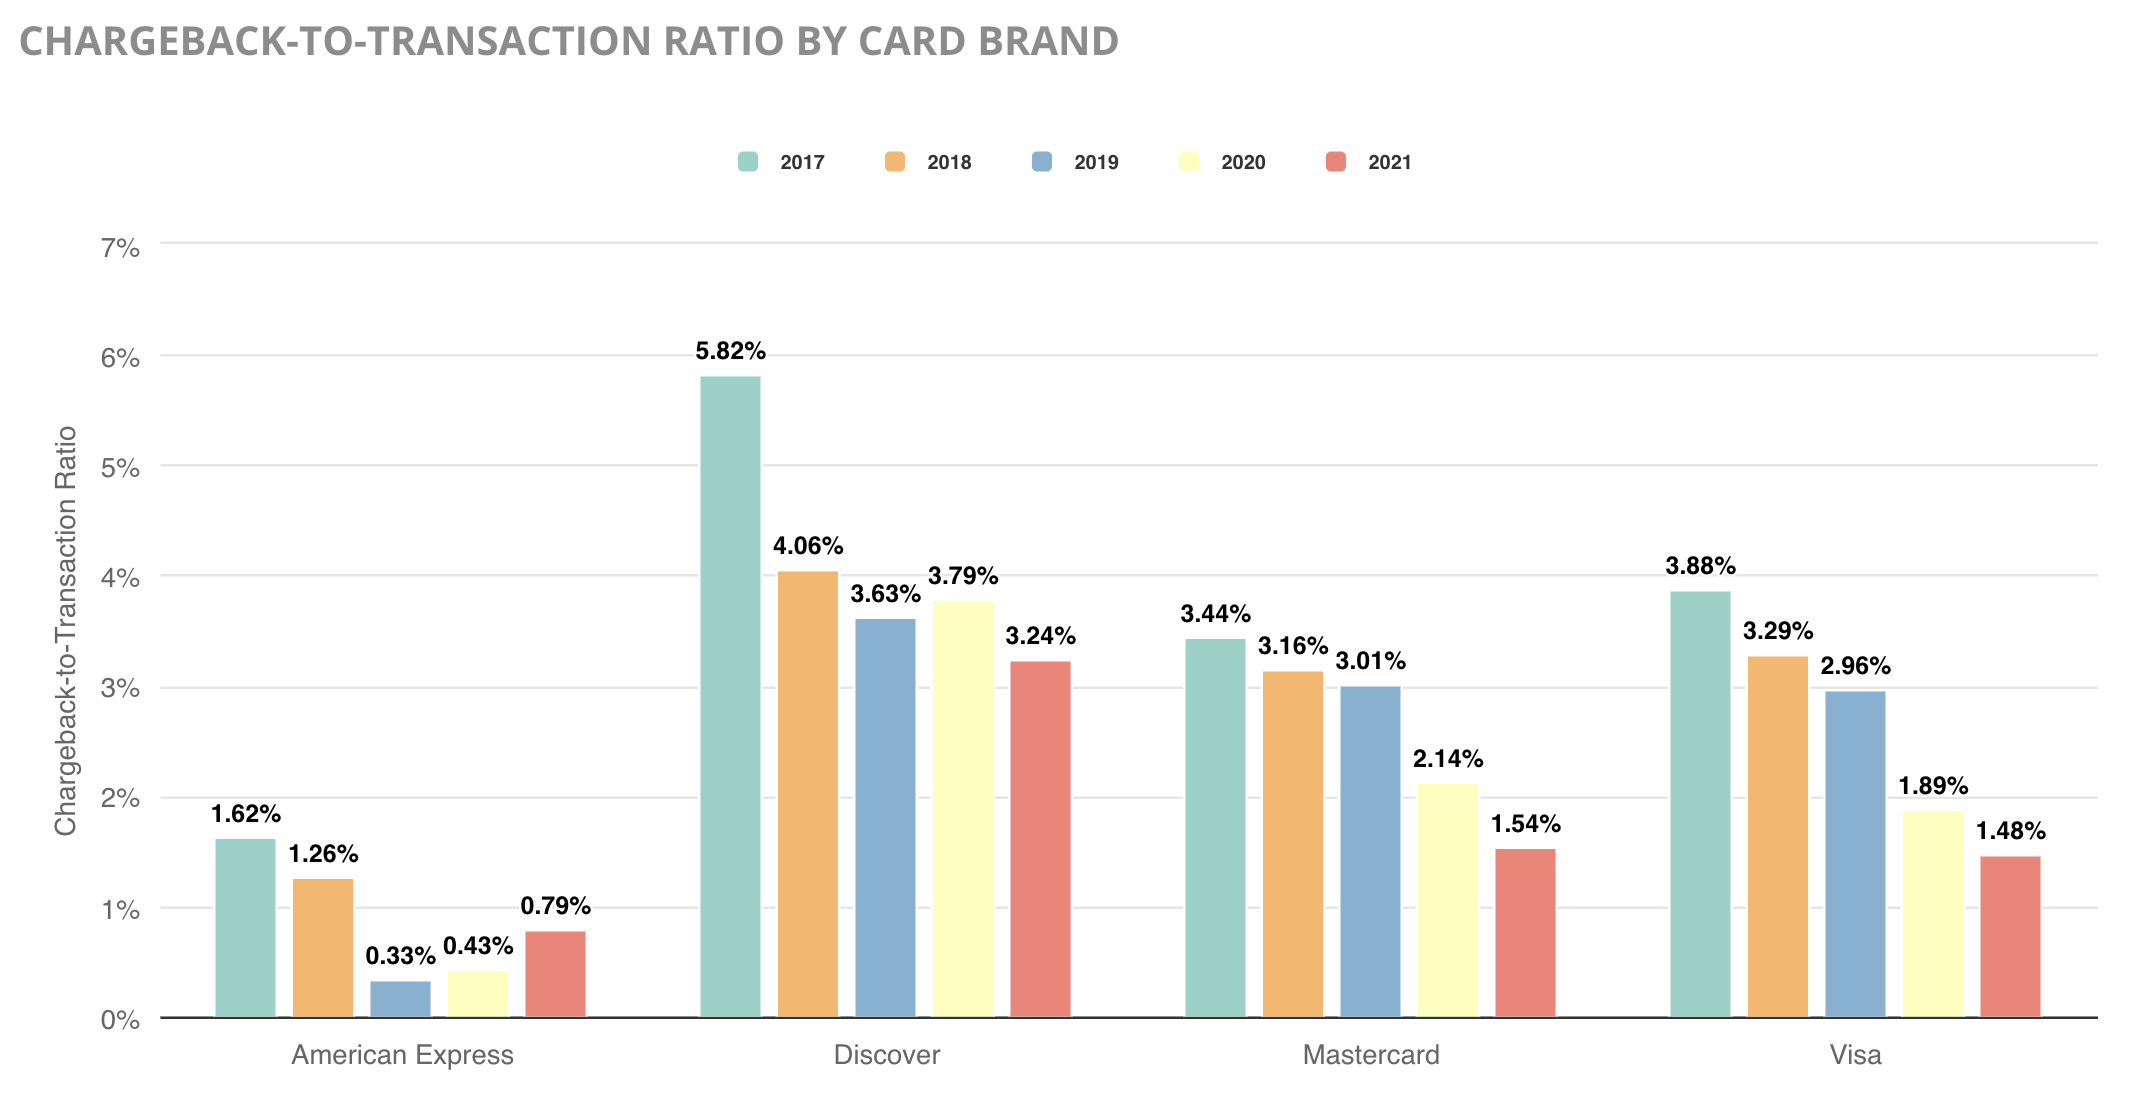
It’s often difficult to detect noteworthy trends for American Express® and Discover®. One reason is because these card brands process significantly fewer transactions than Mastercard and Visa — American Express transactions accounted for 2.47% of the study’s total transaction volume and Discover a mere 1.94%.
Another reason is because American Express and Discover often issue their own branded cards directly to consumers, eliminating the involvement of an issuing bank. This independence enables greater flexibility in creating and enforcing regulations.
Despite the difficulties in interpreting data for these two brands, one influencer was obvious.
American Express and Discover don’t have as many brand-supported chargeback prevention tools as Mastercard and Visa. As a result, American Express saw an increase in the average chargeback-to-transaction ratio while Discover maintained an average that is more than double the ratios for Mastercard and Visa.
Another noteworthy element of the 2021 data is the impact that the COVID-19 pandemic had on the study participants’ chargeback-to-transaction ratio.
While some merchants and specific industries were negatively impacted by high chargeback counts, the majority of merchants in the study experienced a decrease in their chargeback-to-transaction ratio. Government restrictions and social distancing requirements led to a significant increase in card-not-present transactions during 2020 and 2021. And because there wasn’t a proportional increase in chargeback activity, online merchants experienced a welcomed perk amidst an otherwise difficult time.
The chargeback-to-transaction ratio shows that payment disputes are still a major concern for merchants — especially for card-not-present transactions. A 1.52% ratio is well above the card networks’ thresholds. However, the year-over-year decrease is encouraging.
Merchants in this study were actively managing disputes and attempting to keep risk in check. They had benefited from Kount's expert advice and advanced technology. Therefore, the drop in the chargeback-to-transaction ratio suggests that ongoing efforts and professional expertise help prevent chargebacks with greater accuracy.
Percent of Revenue Lost to Chargebacks
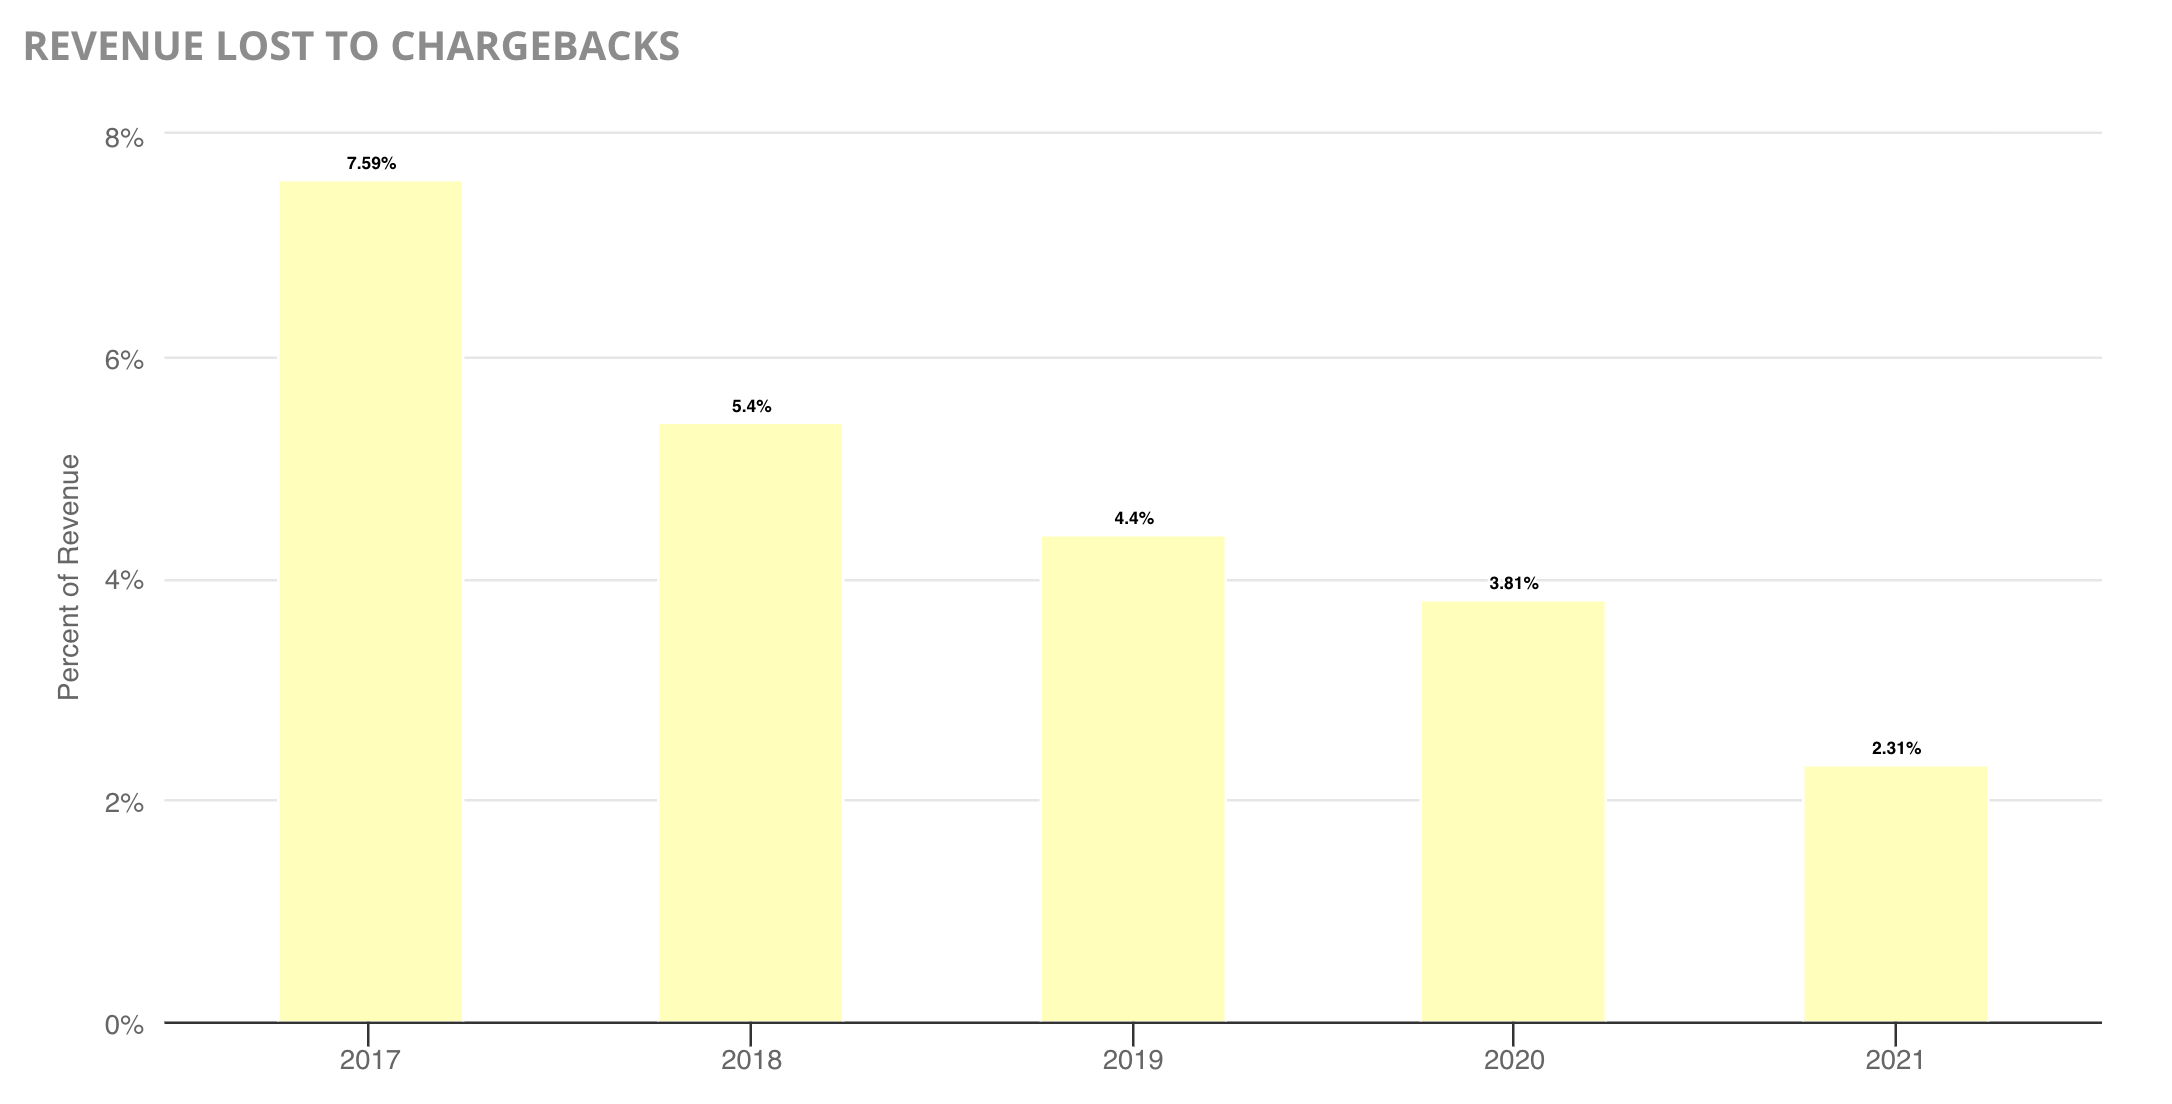
The absolute “cost” of each chargeback varies and is impacted by several different expenses: lost processing fees, chargeback fines, labor costs for management, and much more. However, since the largest and most easily-defined loss is the transaction amount, monitoring the percent of revenue lost to chargebacks is likely the most accurate gauge of financial impact.
The total amount of revenue lost to chargebacks decreased by 39.4% between 2020 and 2021, totaling a 69.6% reduction over four years. This drop is relative to the decrease in the chargeback-to-transaction ratio.
Again, investing in proven-effective chargeback management strategies yields a positive ROI by reducing the amount of revenue lost to chargebacks.
However, there is no way to guard against all risk. Therefore, merchants are advised to have a plan in place to fight illegitimate chargebacks when they do happen, recover lost revenue, and protect their bottom line.
Why does The Year in Chargebacks report show a decrease in year-over-year trends when other reports show chargeback risks to be intensifying? The difference is an active and ongoing effort to manage risk.
If merchants didn’t do anything to curb the ever-present threat of chargebacks, these charts would look much different. However, the merchants in this study recognize the danger that chargebacks pose to their business, and Kount has helped them take proactive action to minimize risk as much as possible.
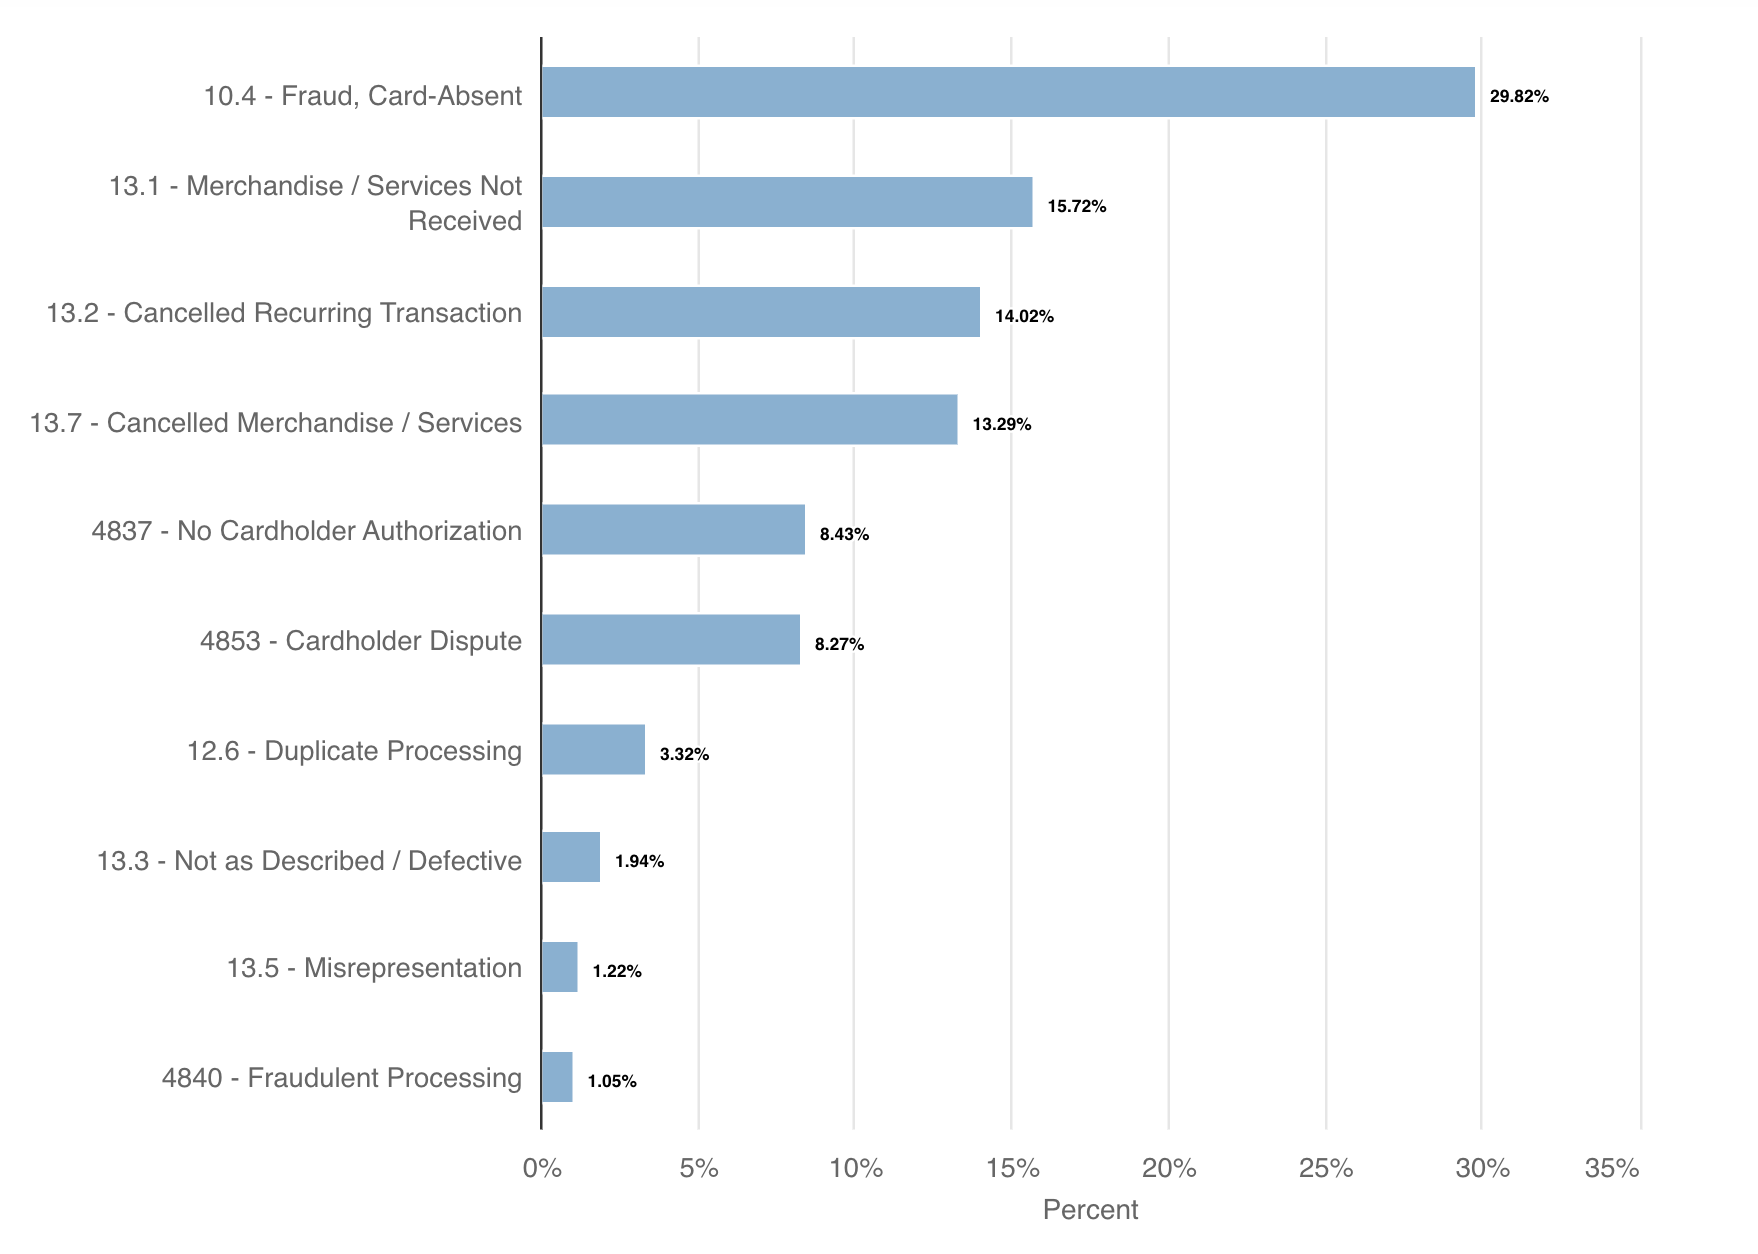
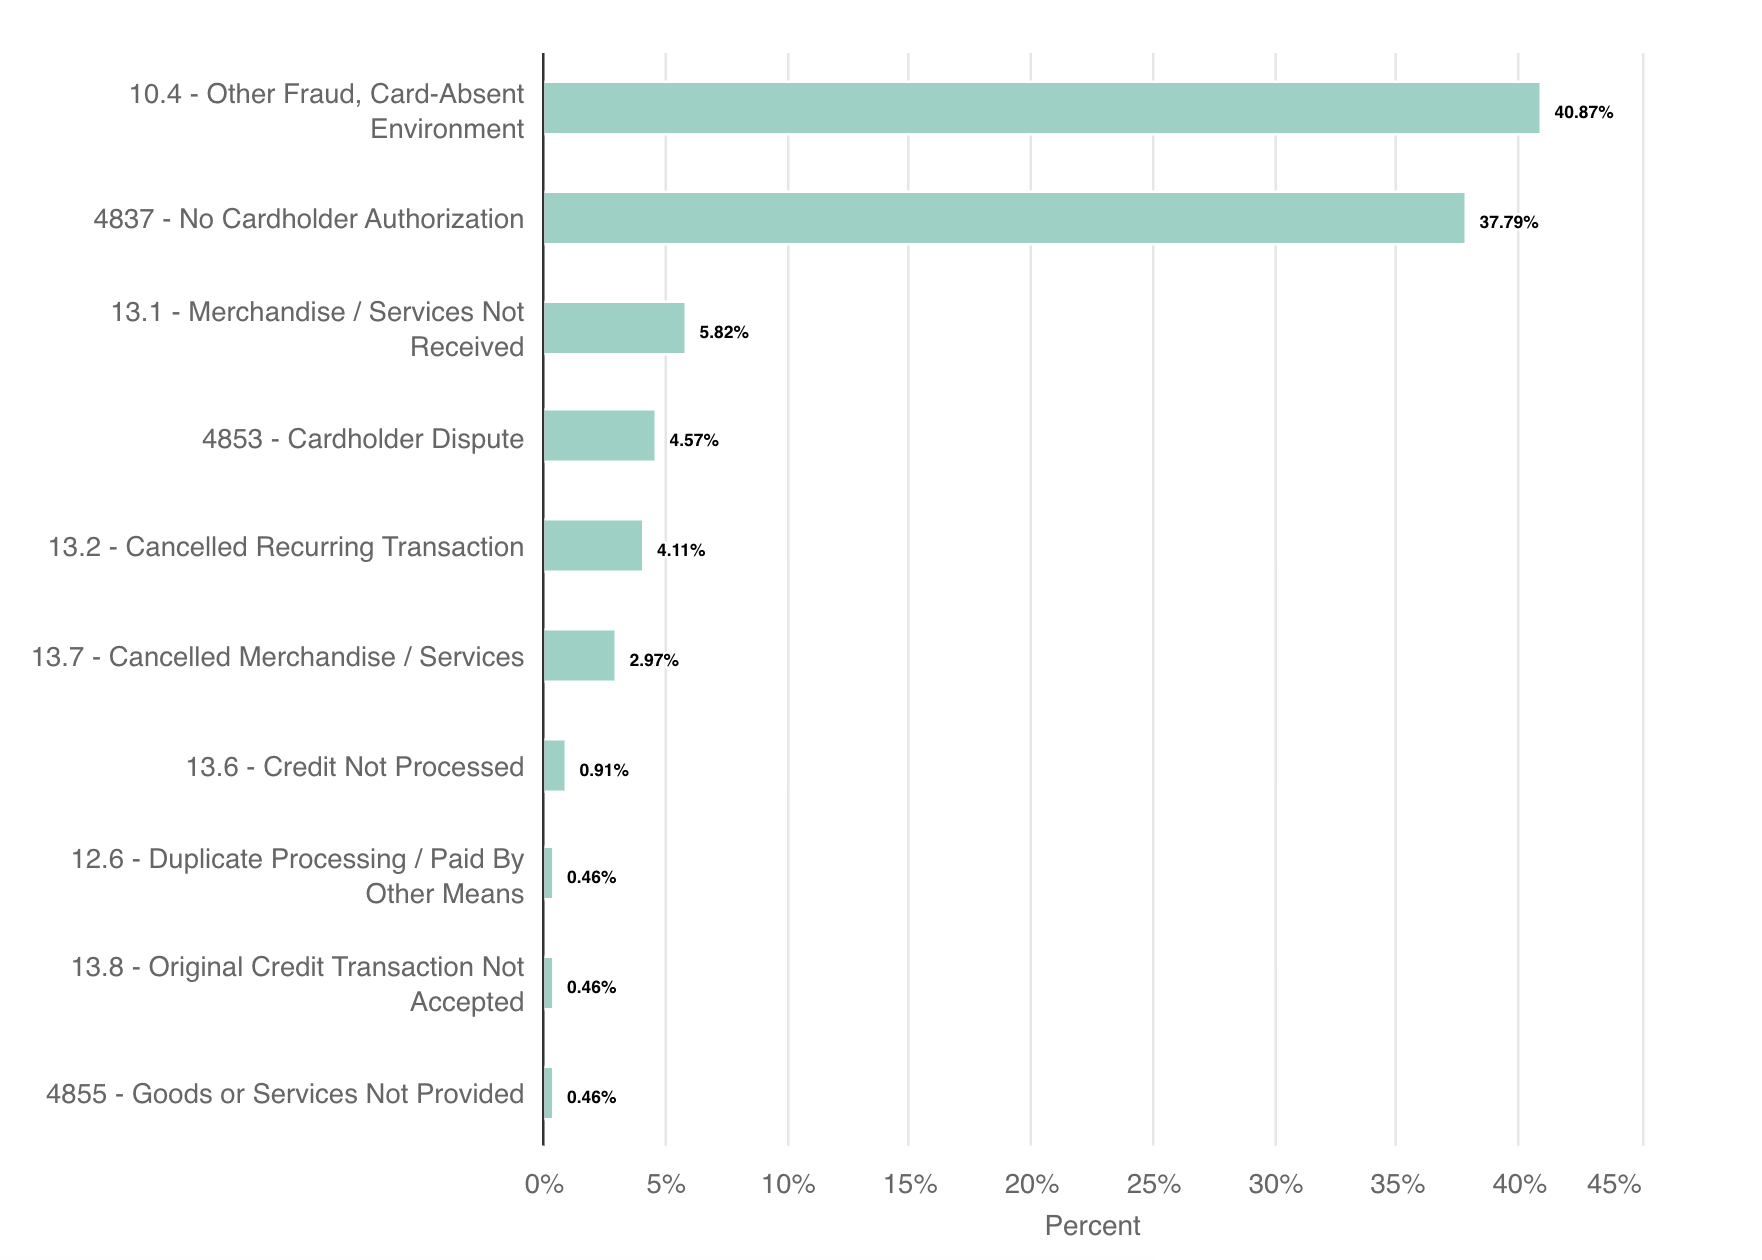
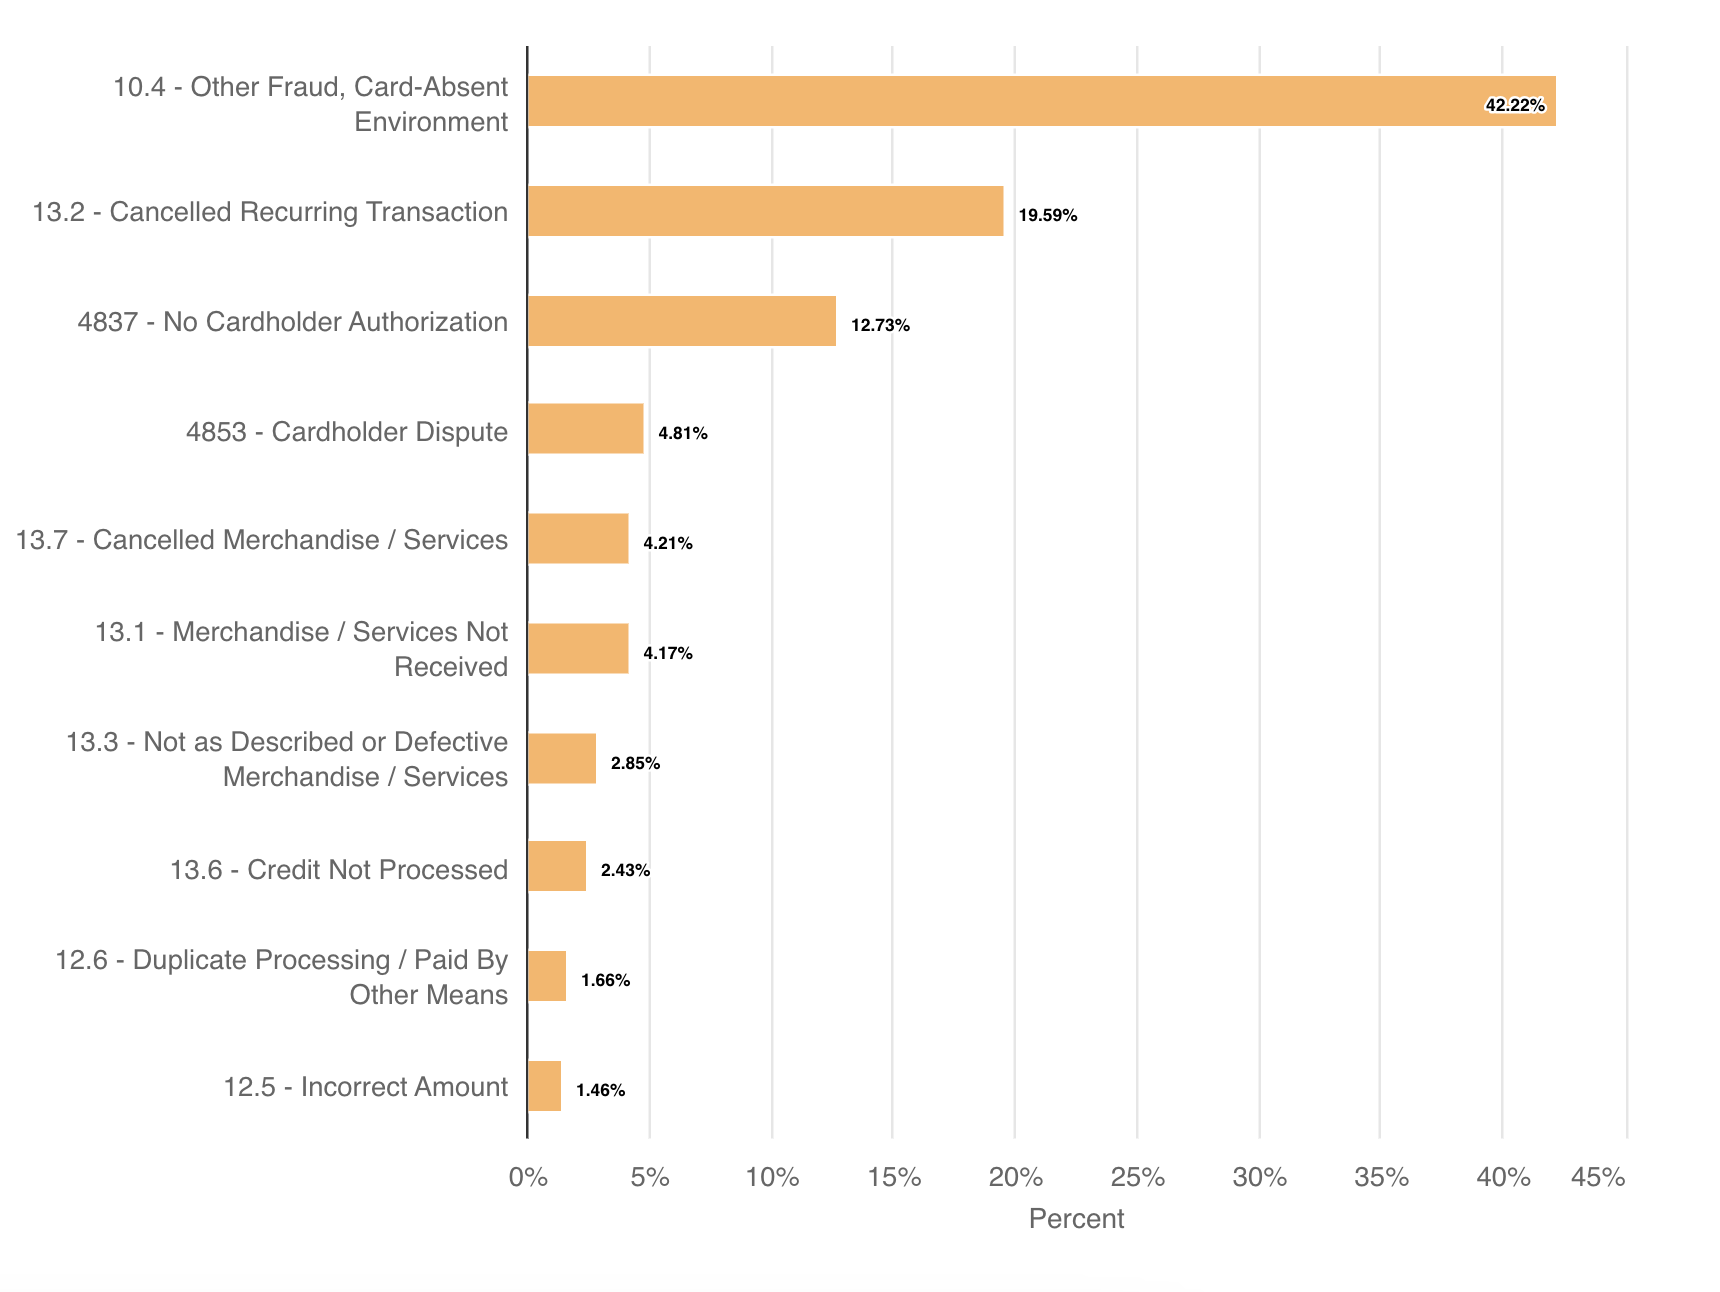
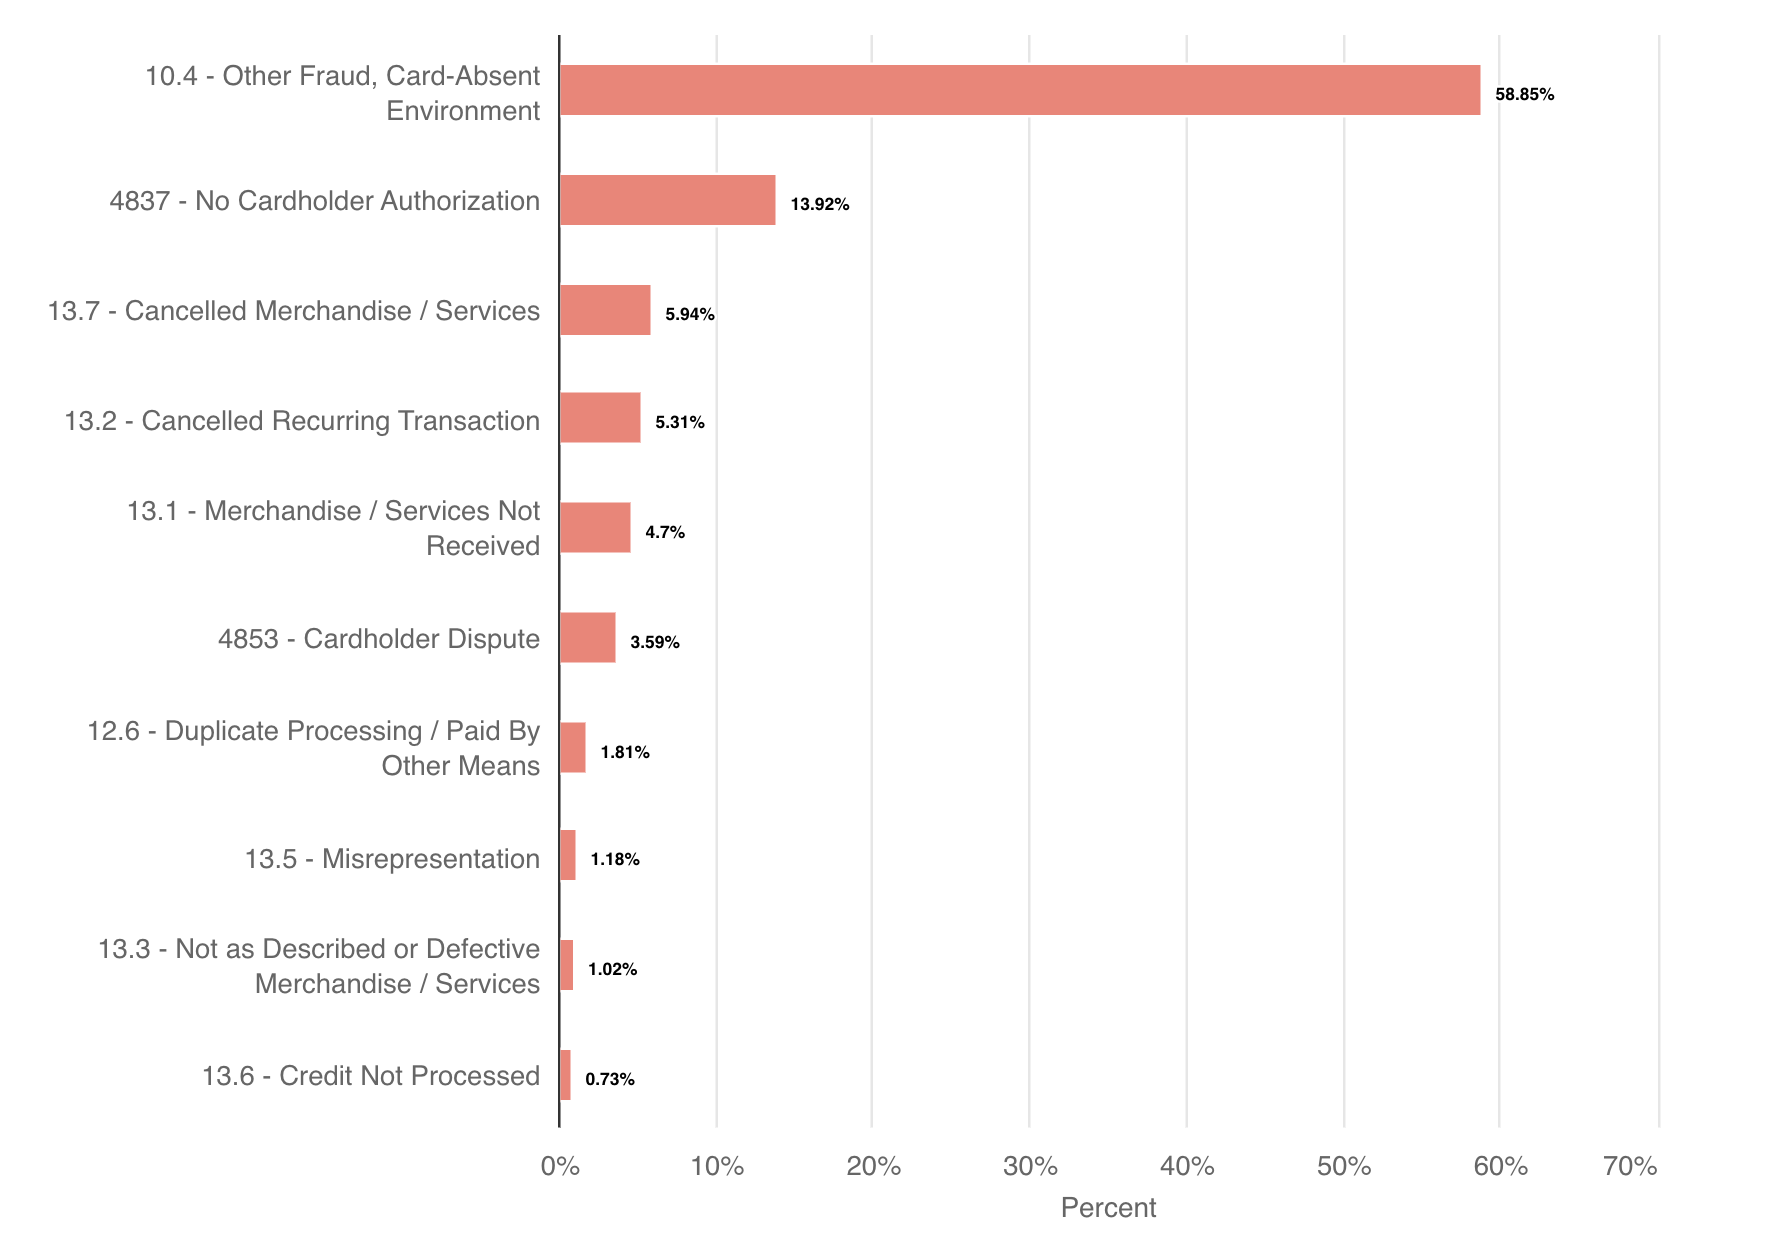
Most Common Reason for Disputes
Why are transactions disputed? What reasons do cardholders and their banks offer?
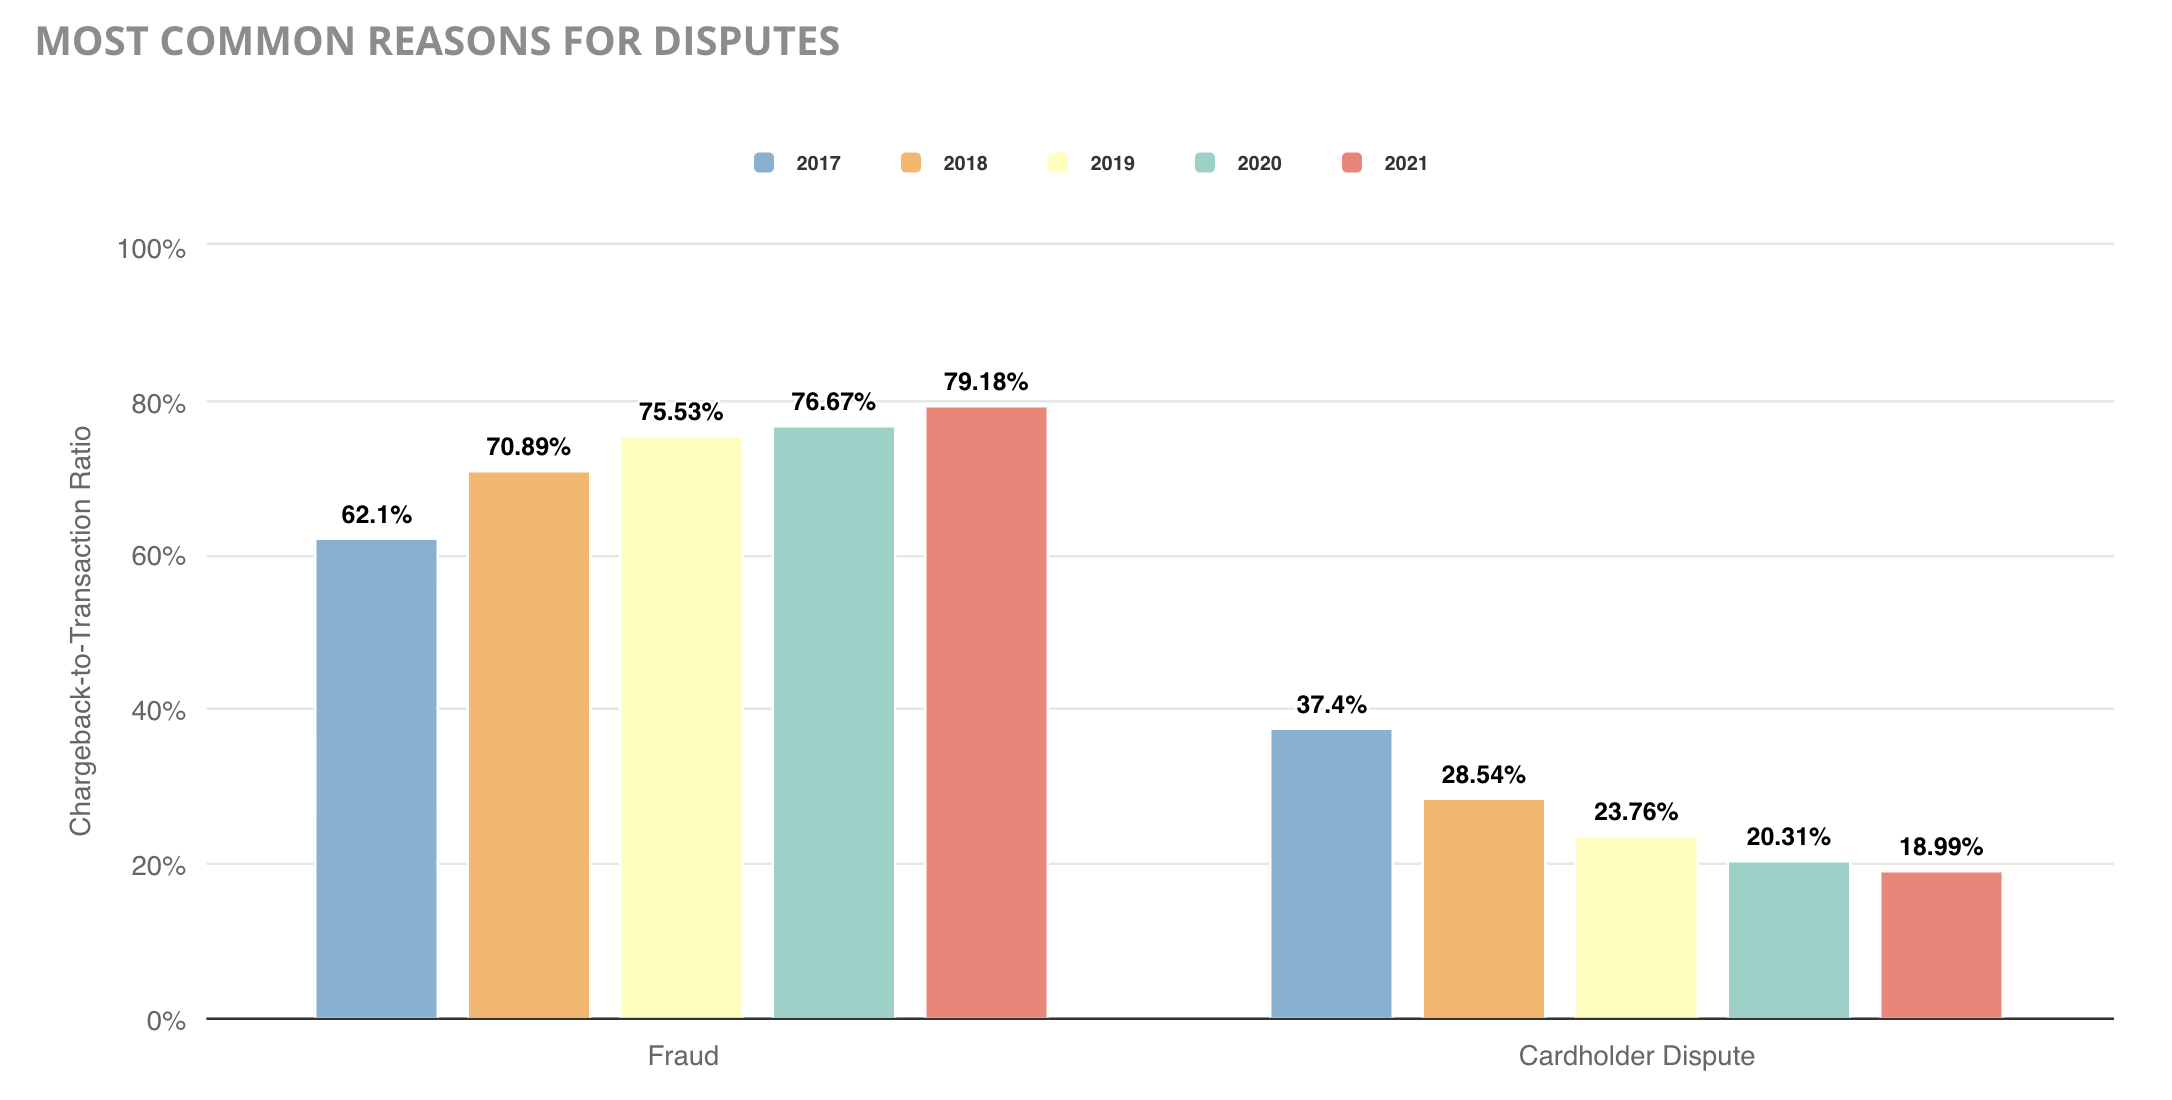
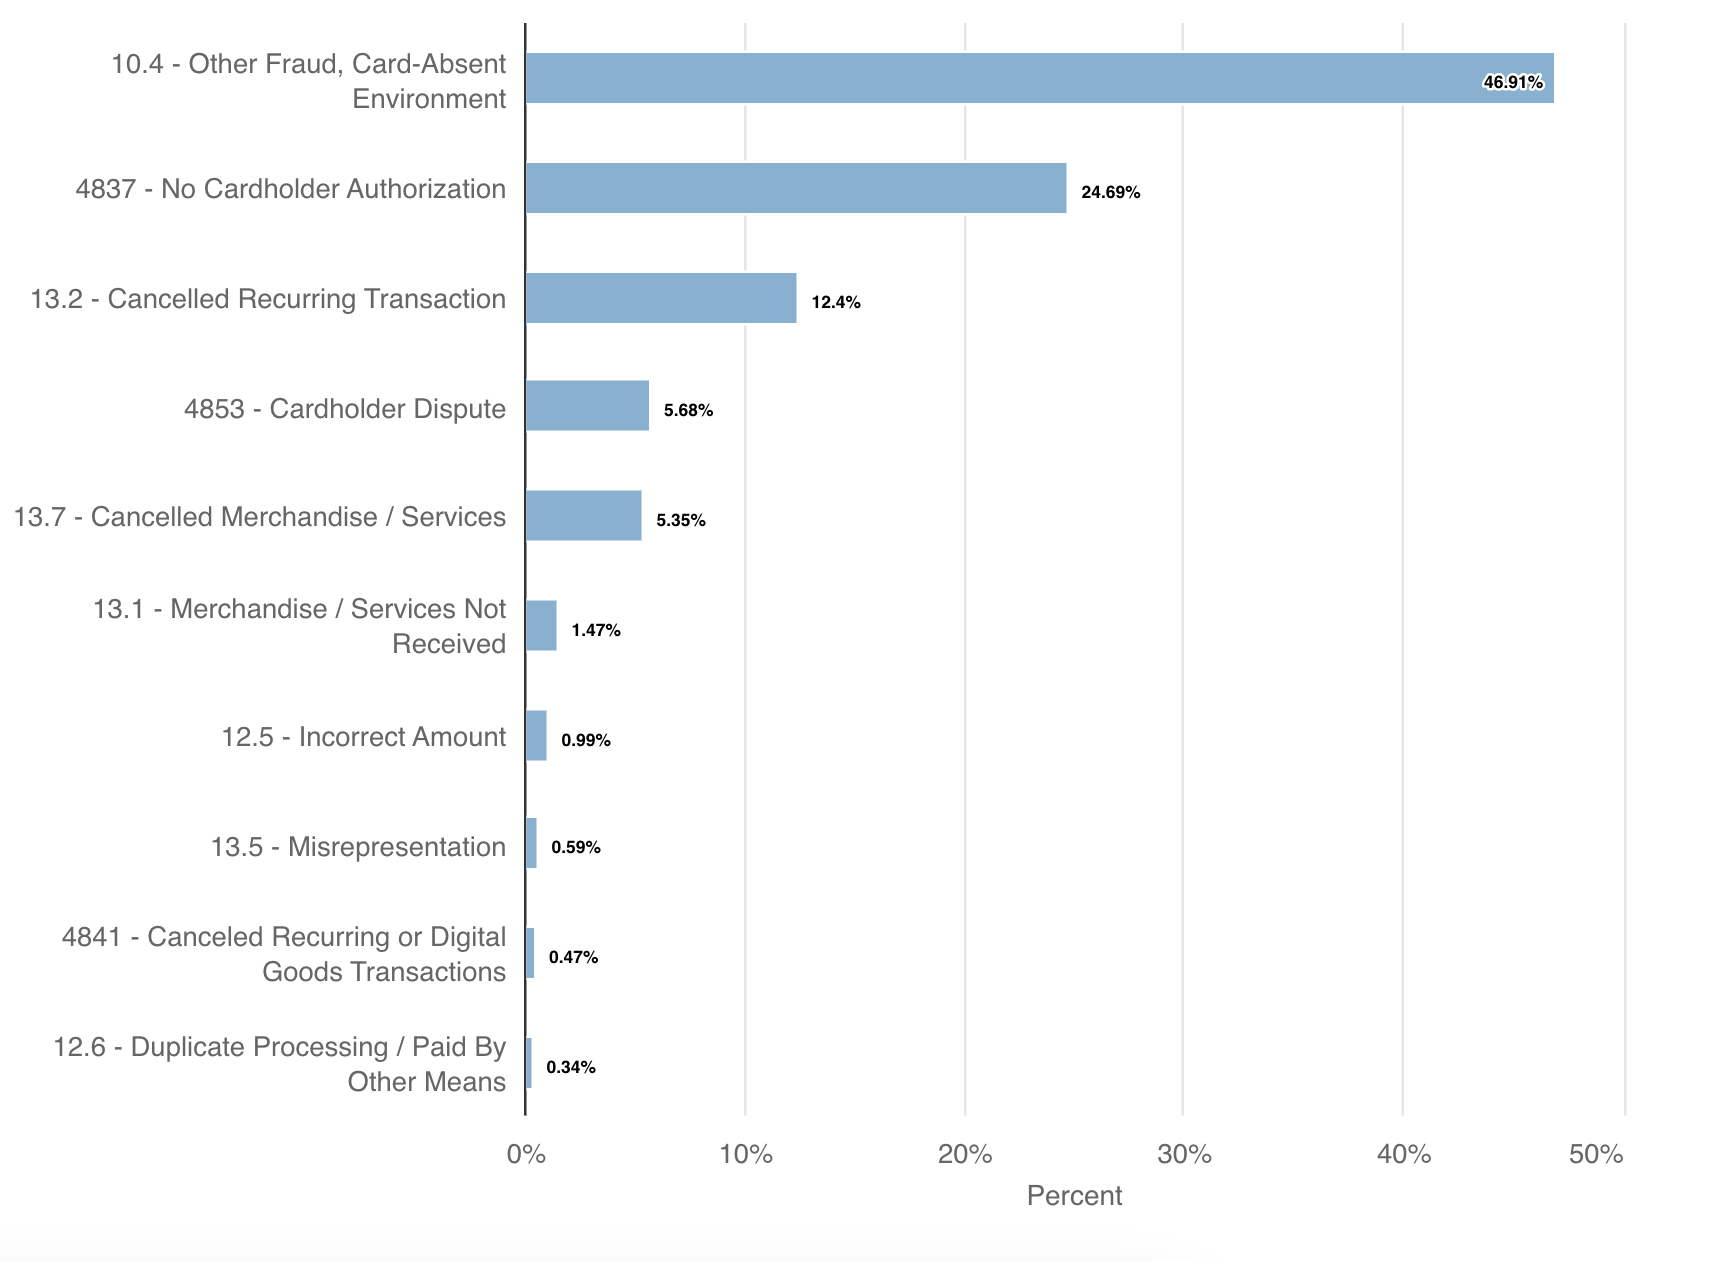
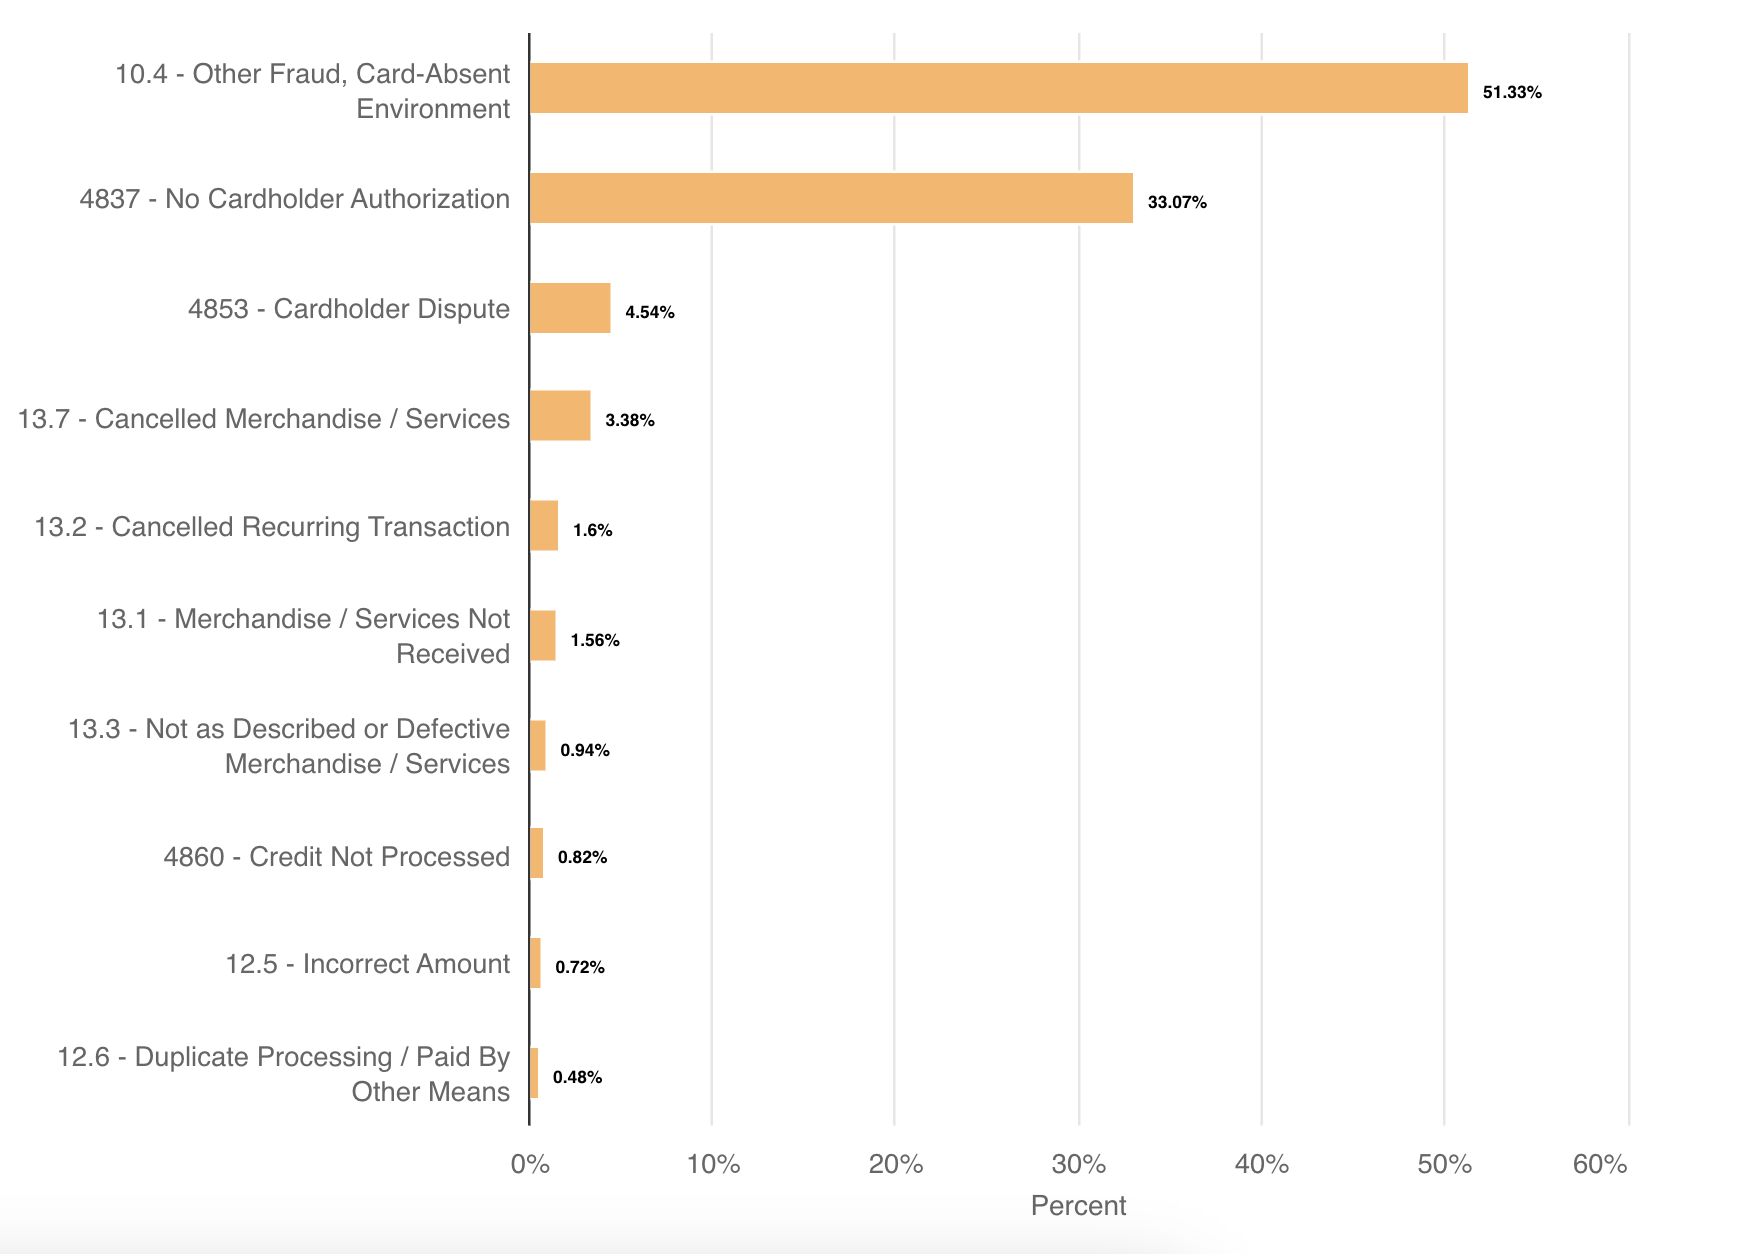
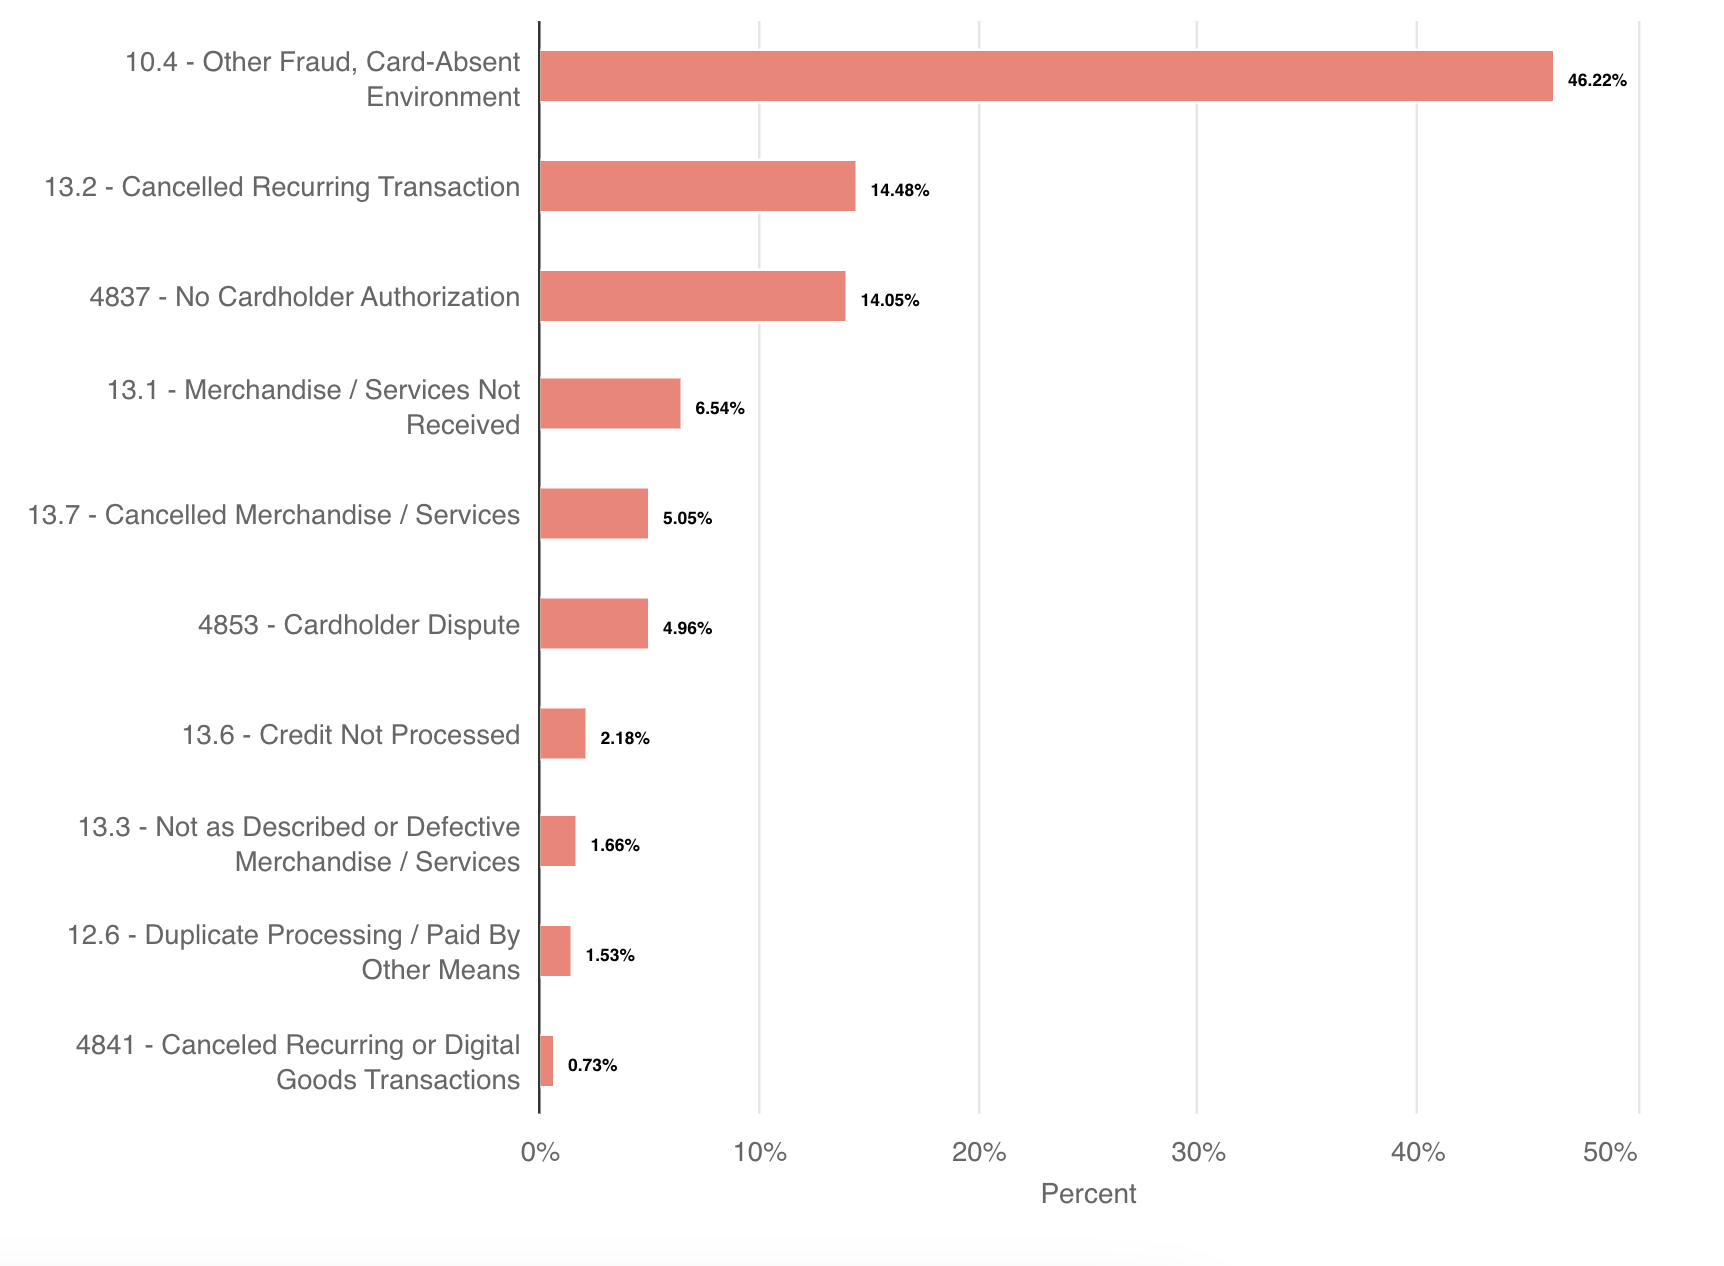
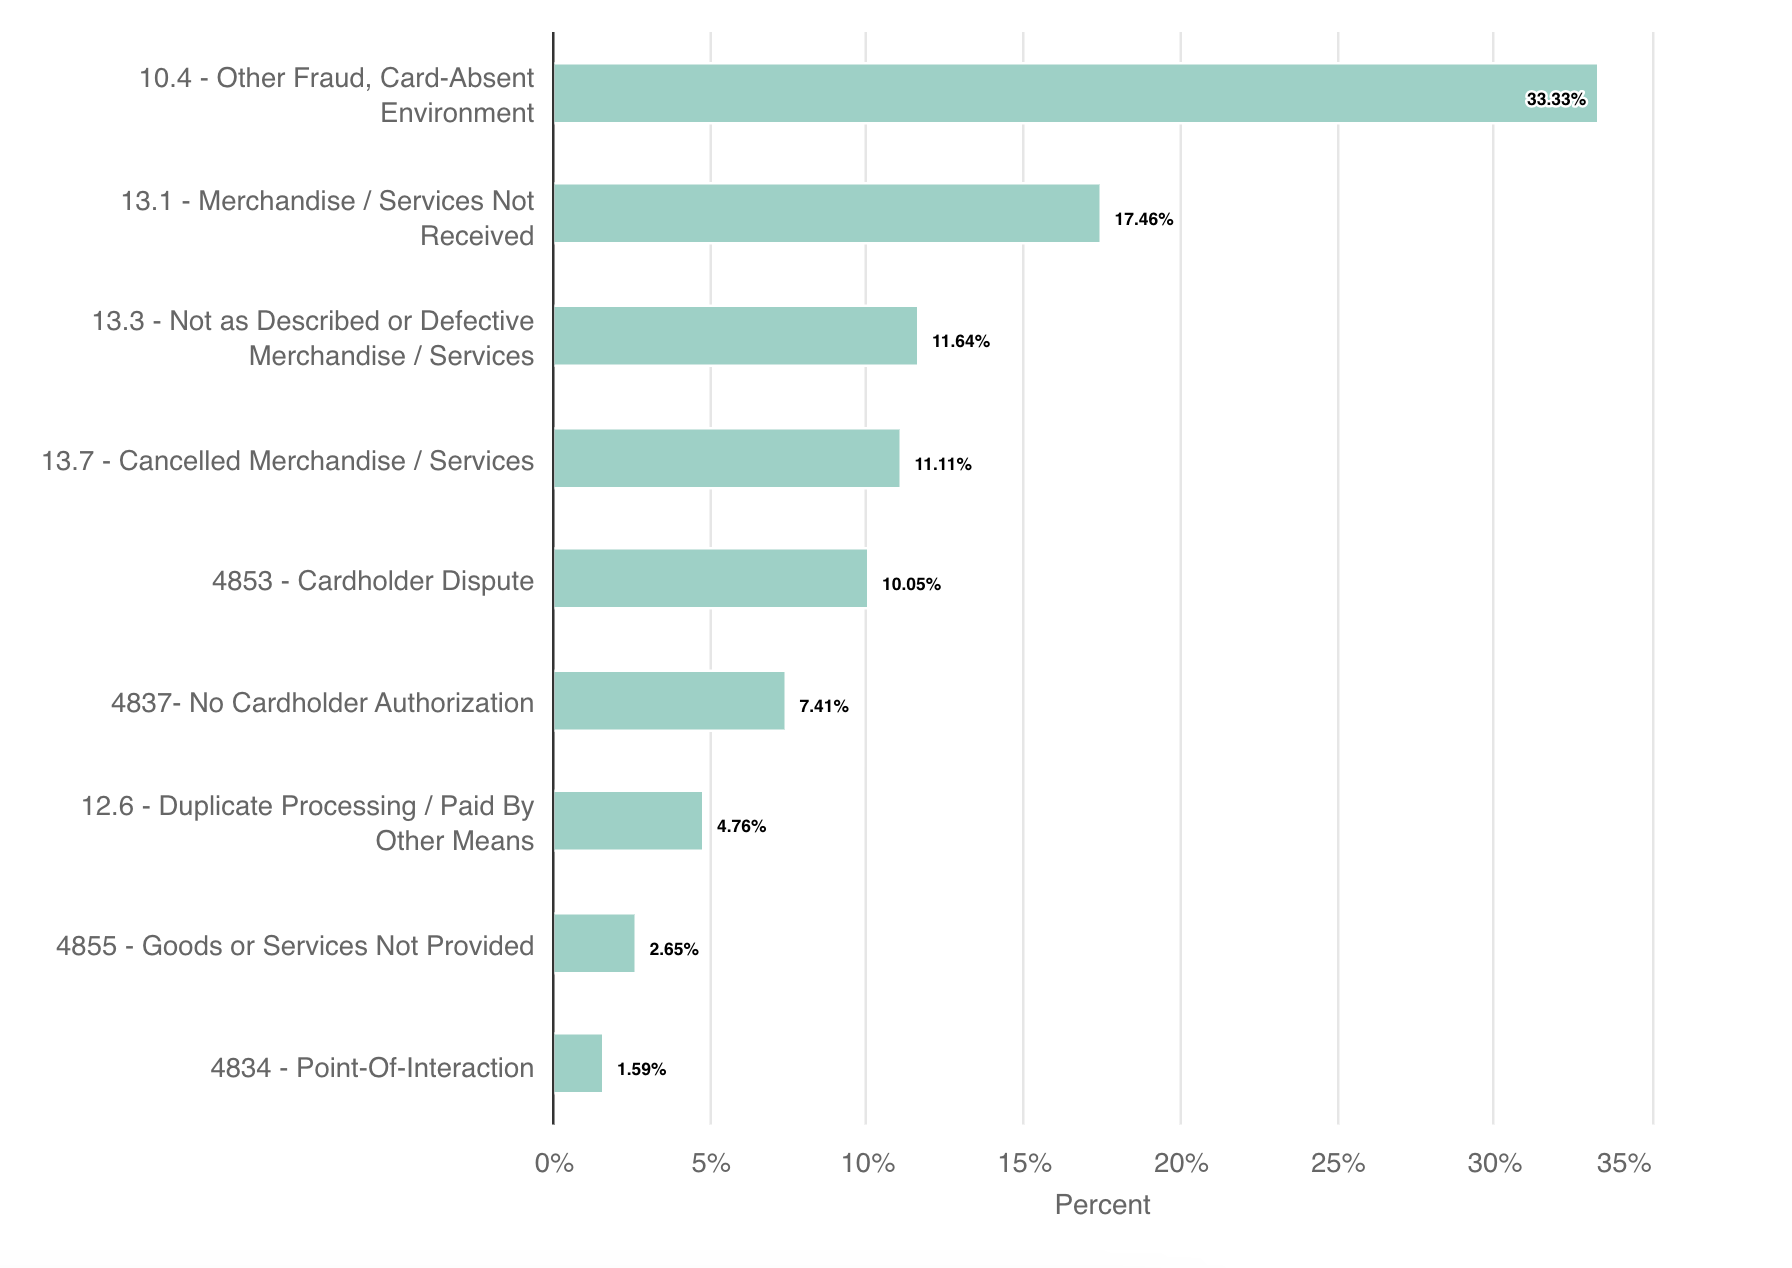
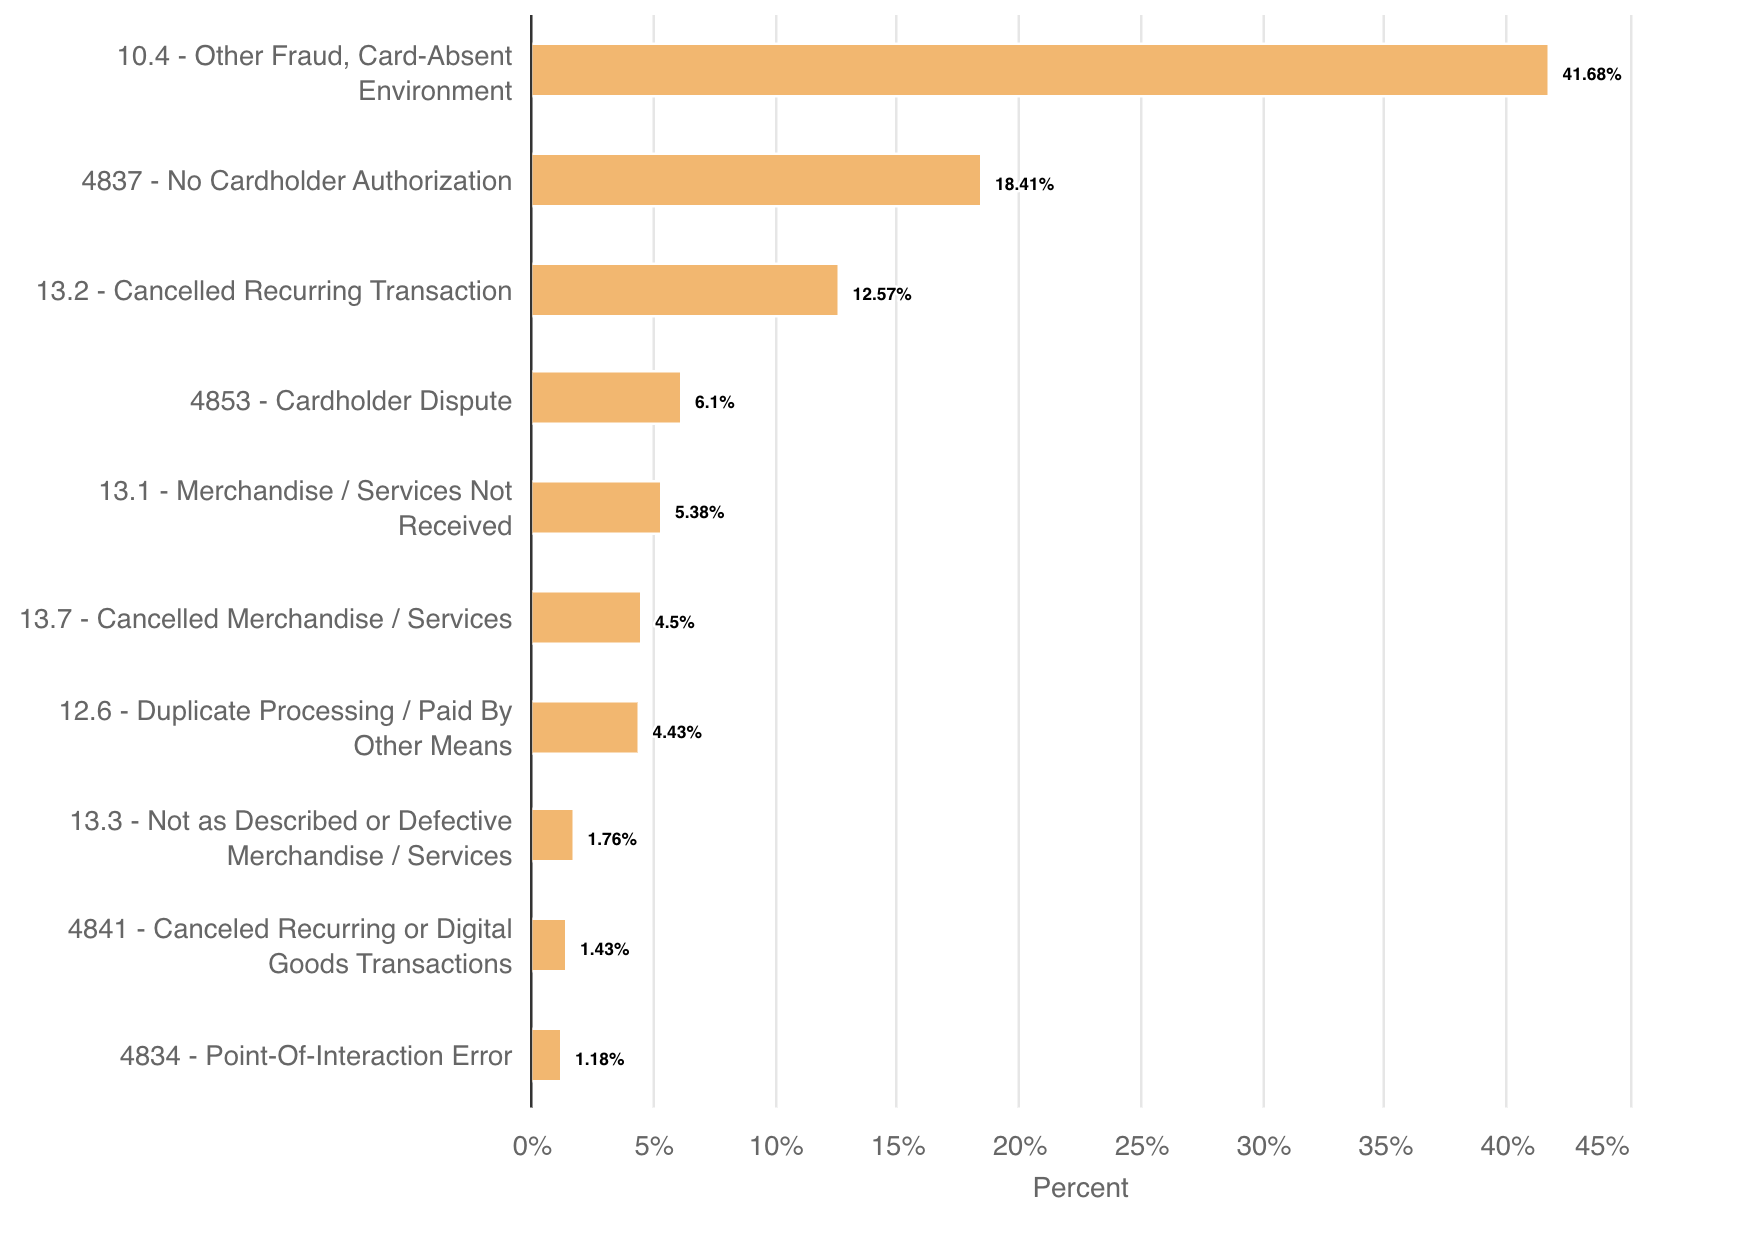
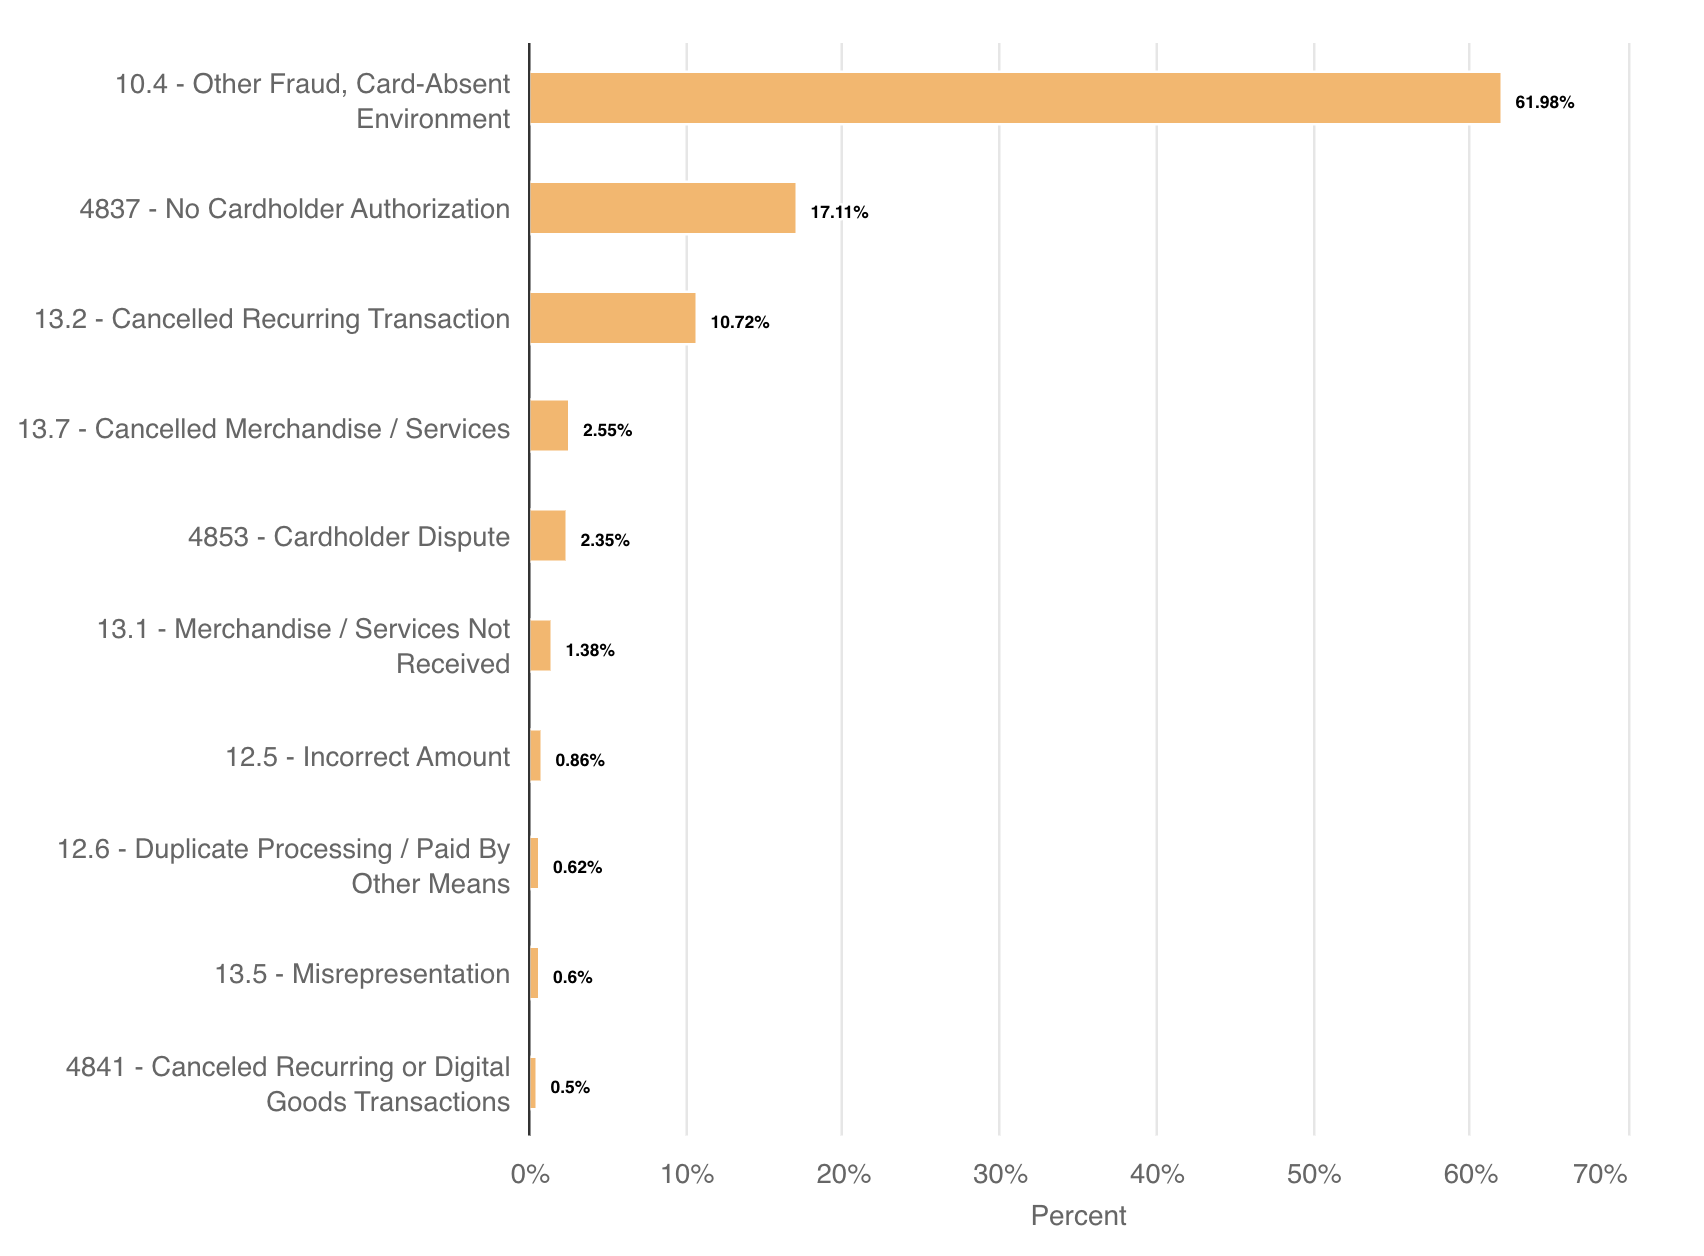
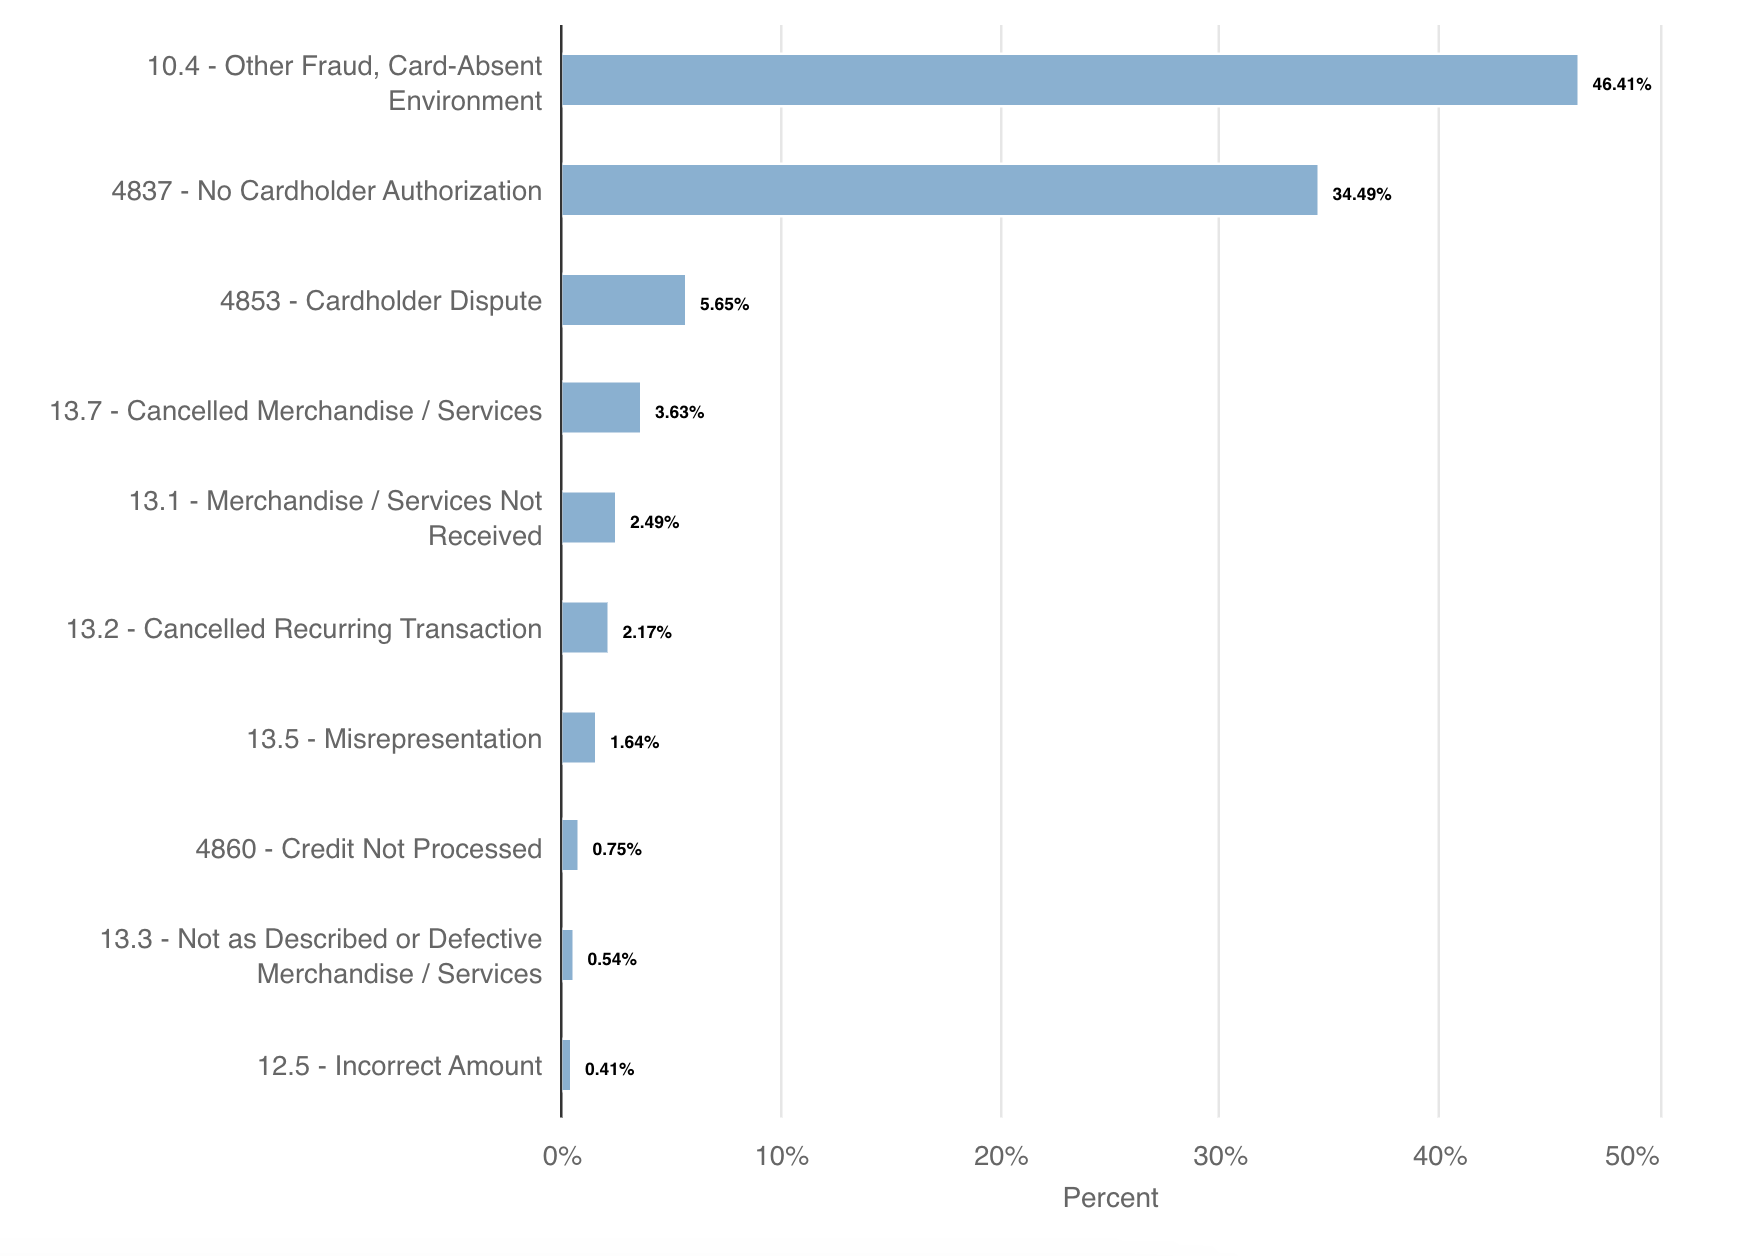
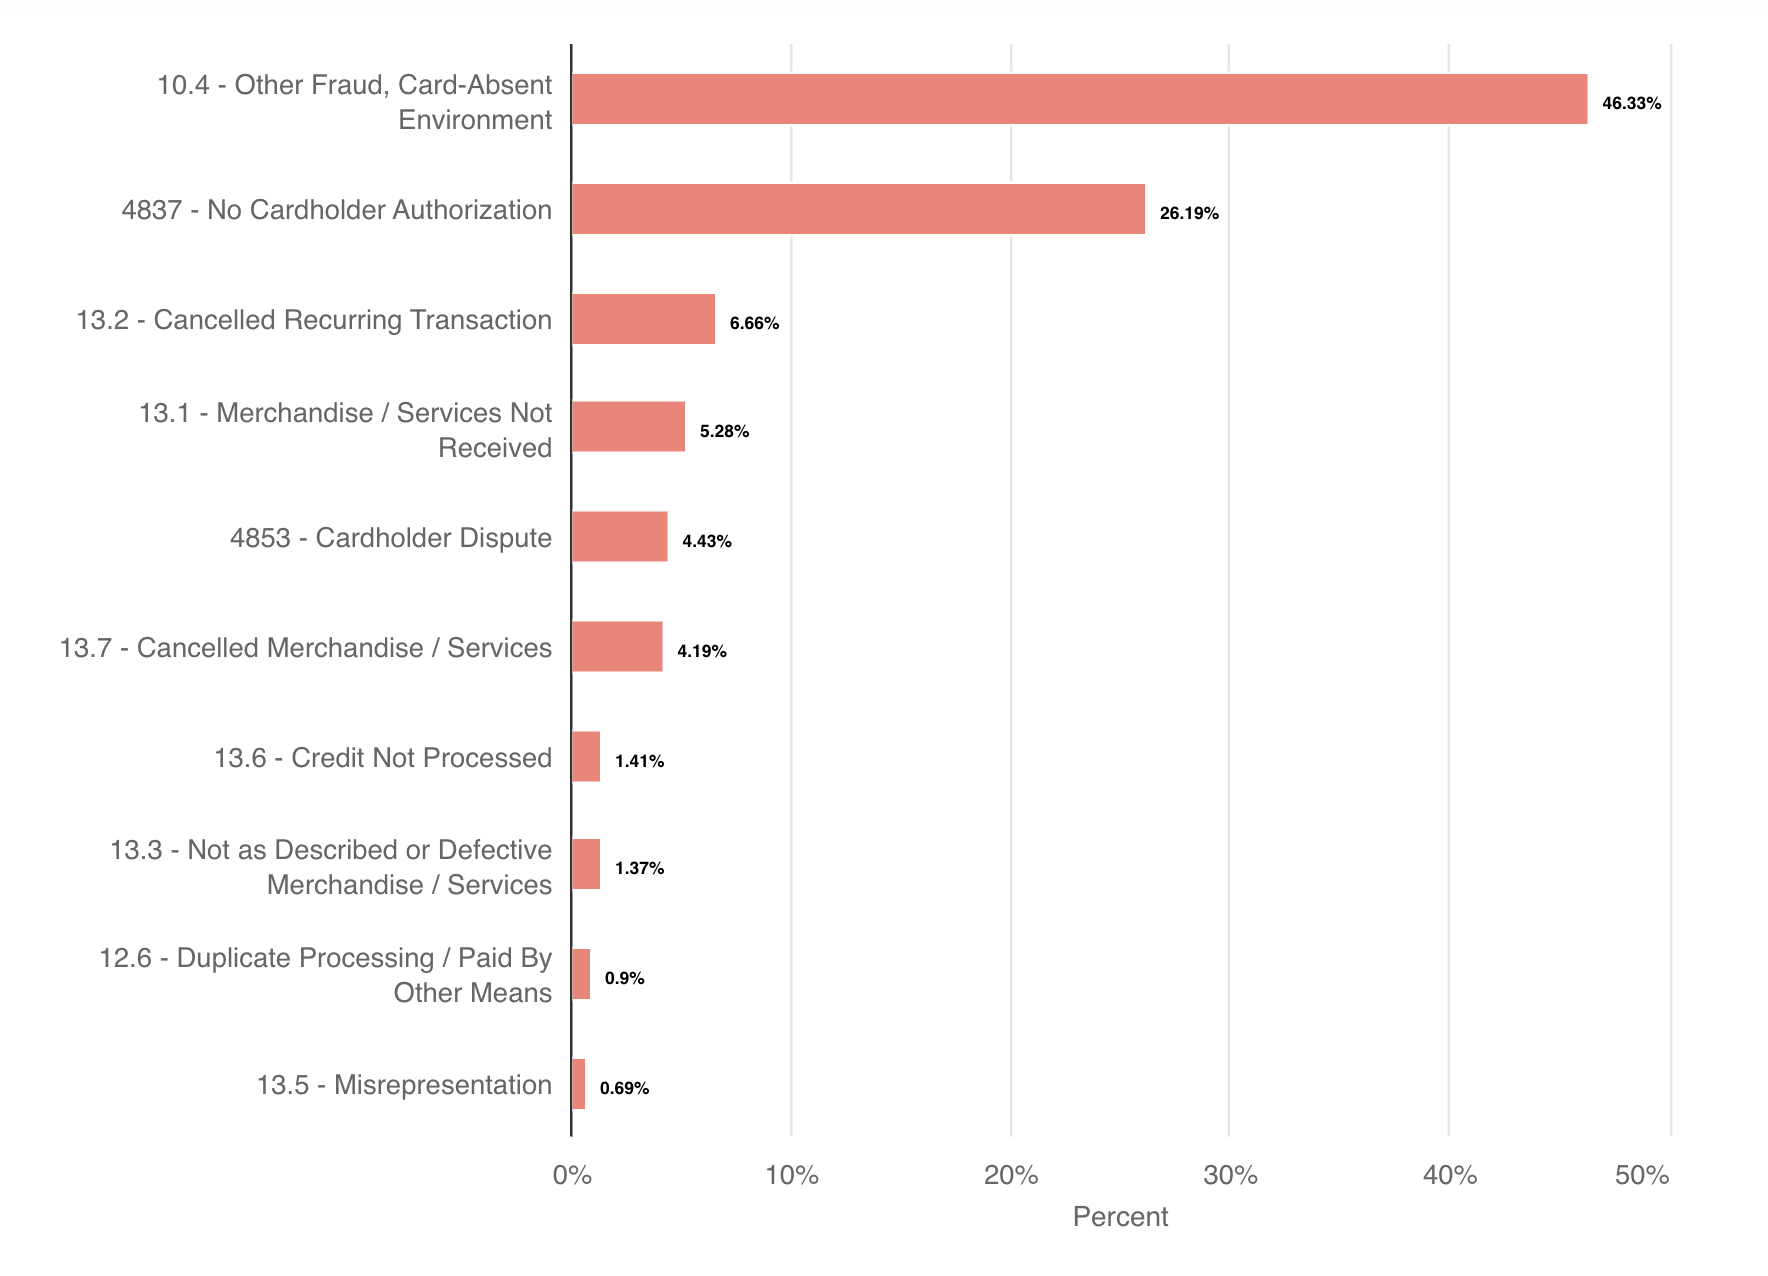
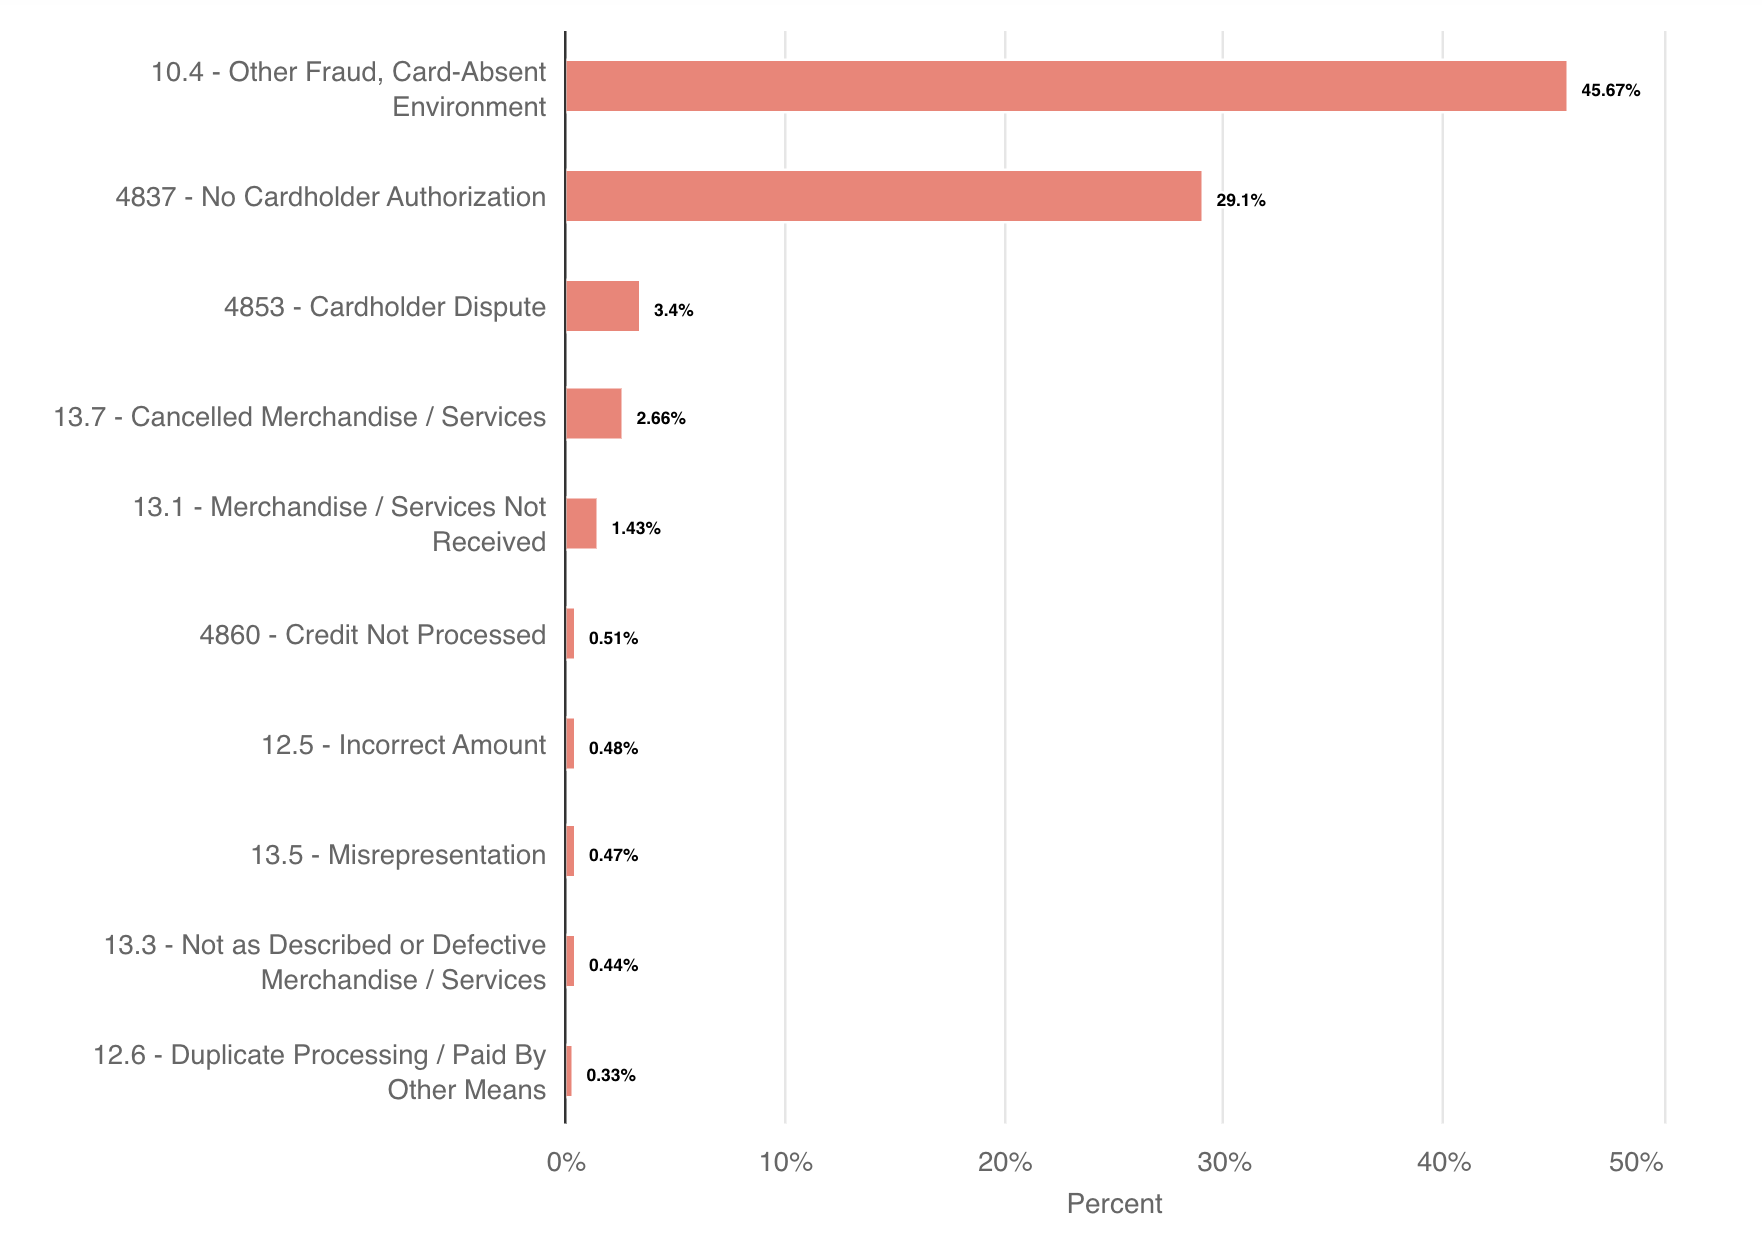
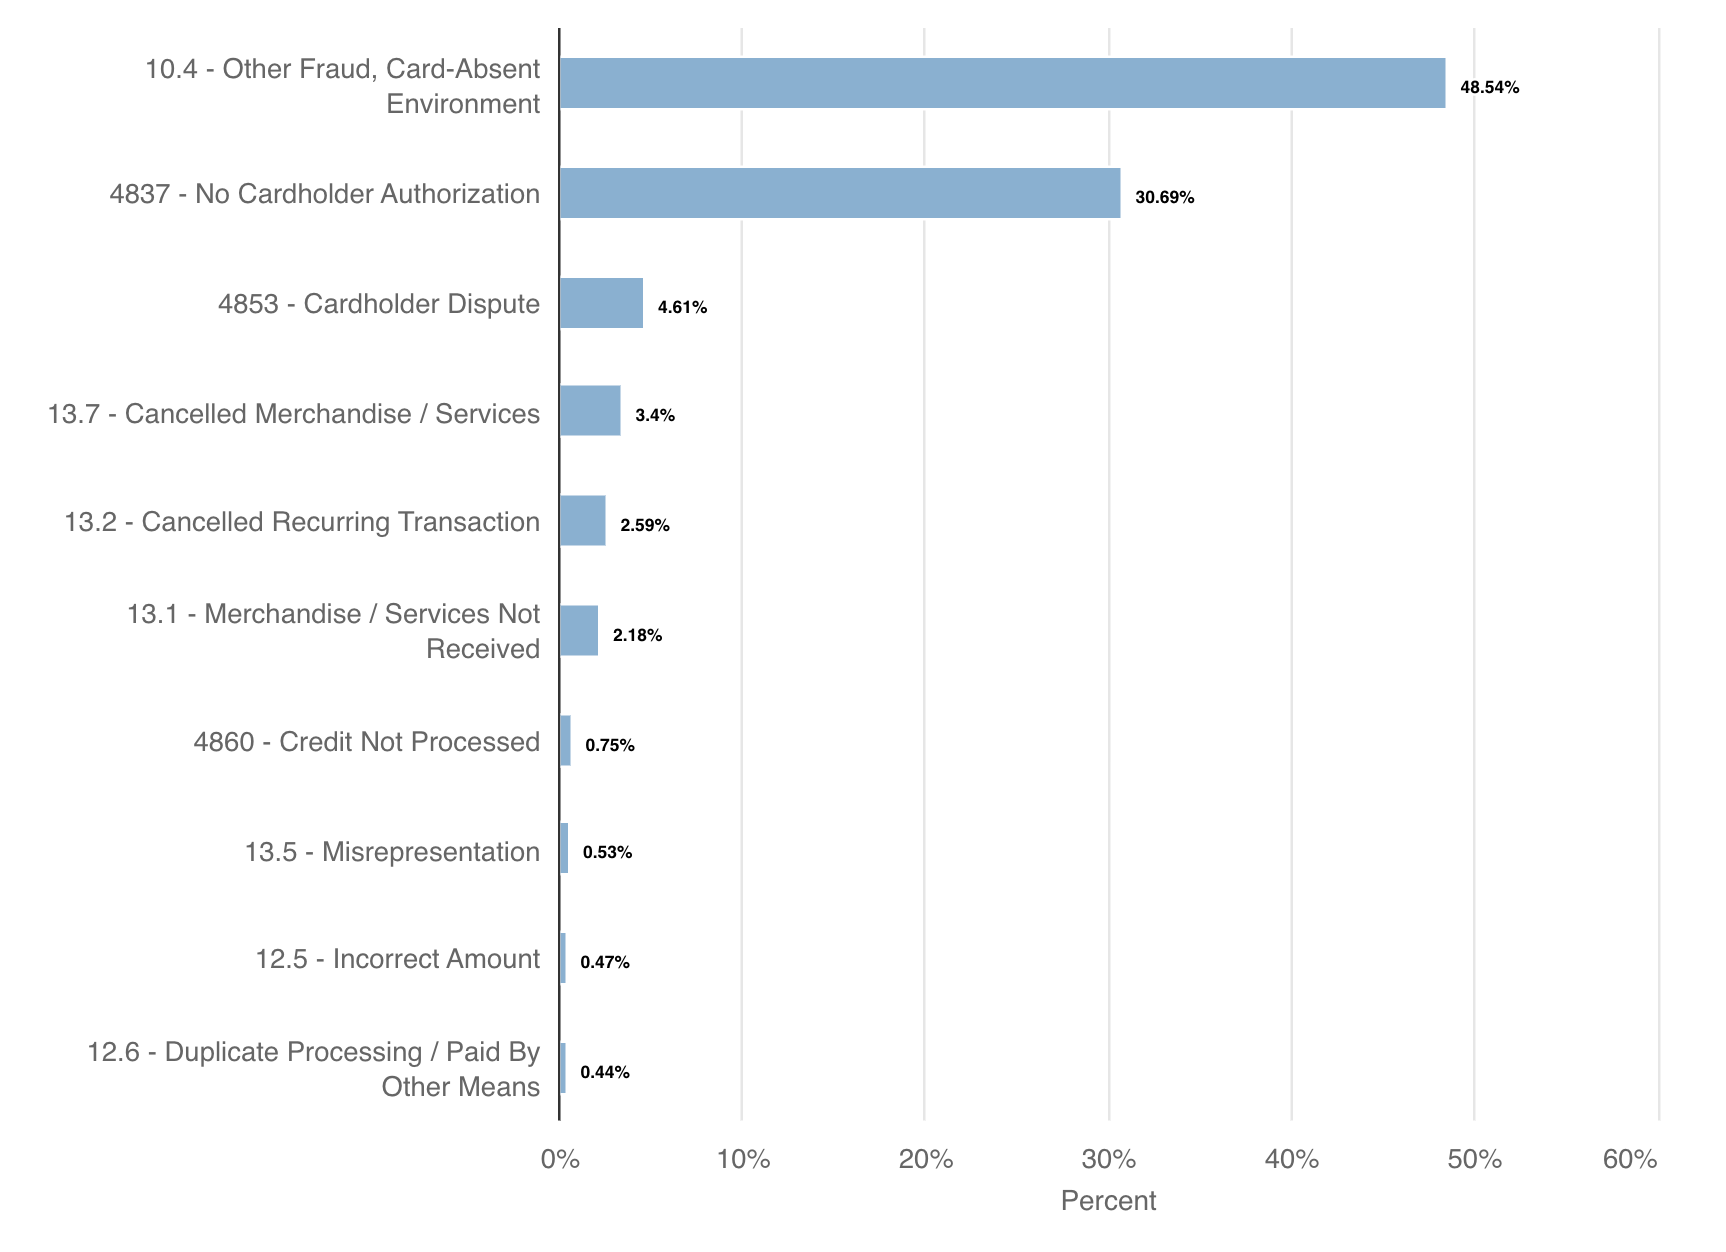
Four different categories are used to classify chargebacks. These categories vary slightly based on the card brand but can generally be thought of as fraud, cardholder disputes, authorization issues, and processing errors. The cardholder’s bank reviews each case and picks the category (or reason) that seems to be the best fit for the dispute.
For the fifth year in a row, fraud-related disputes accounted for the vast majority of chargebacks. The second most common category was cardholder disputes. Processing errors and authorization issues combined accounted for less than 2% of chargebacks.
Why are more and more chargebacks classified as fraud? Because the classification process is flawed.
The cardholder’s bank assigns a reason code to each chargeback before sending it to the merchant. Oftentimes, the reason code assignment is based on limited knowledge and insight.
In most cases, the bank chooses a course of action based on information the cardholder provides. If the cardholder is using the chargeback process incorrectly — a practice commonly referred to as “friendly” fraud — the information provided to the bank could be inaccurate or incomplete. Thus, the reason code doesn’t reflect the real reason for the dispute.
Win Rates and the ROI of Fighting Chargebacks
Card brand regulations give merchants the right to respond to invalid chargebacks.
An invalid chargeback is an unnecessary or non-compliant payment dispute — a chargeback that shouldn’t have happened.
Some chargebacks are invalid because they don’t follow card brand rules. Other times, a cardholder uses the chargeback process incorrectly, either as an intentional attempt to get something for free or an innocent misunderstanding.
When disputes are invalid, merchants can and should fight back. Attempting to reverse the chargeback and the resulting revenue loss can significantly improve a business’s bottom line.
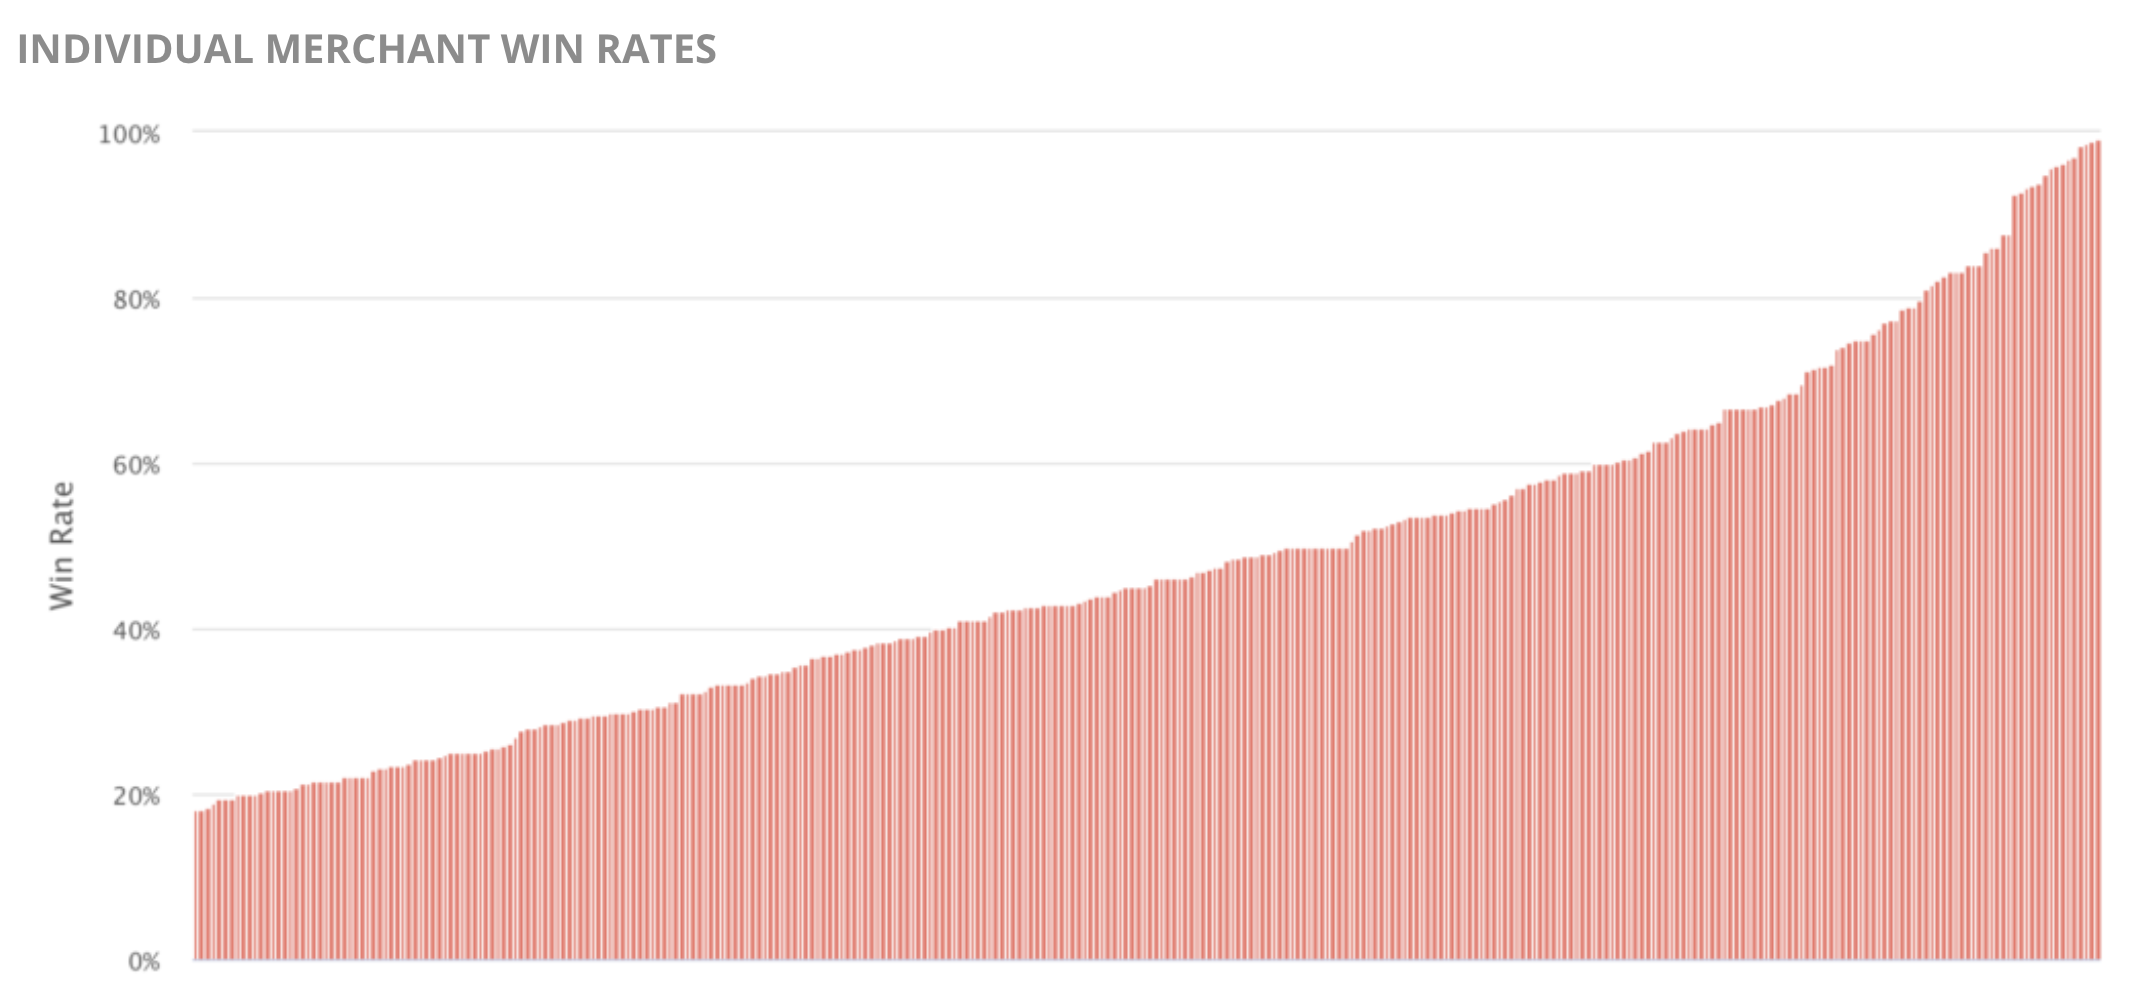
The vast majority of merchants in this study made fighting chargebacks a top priority. Just over 77% of merchants had a win rate above the industry average of 30%.
Other merchants focused on providing the smooth and simple checkout process that today’s consumers demand. Thirty-four percent of merchants in this study opted out of using identity verification tools.
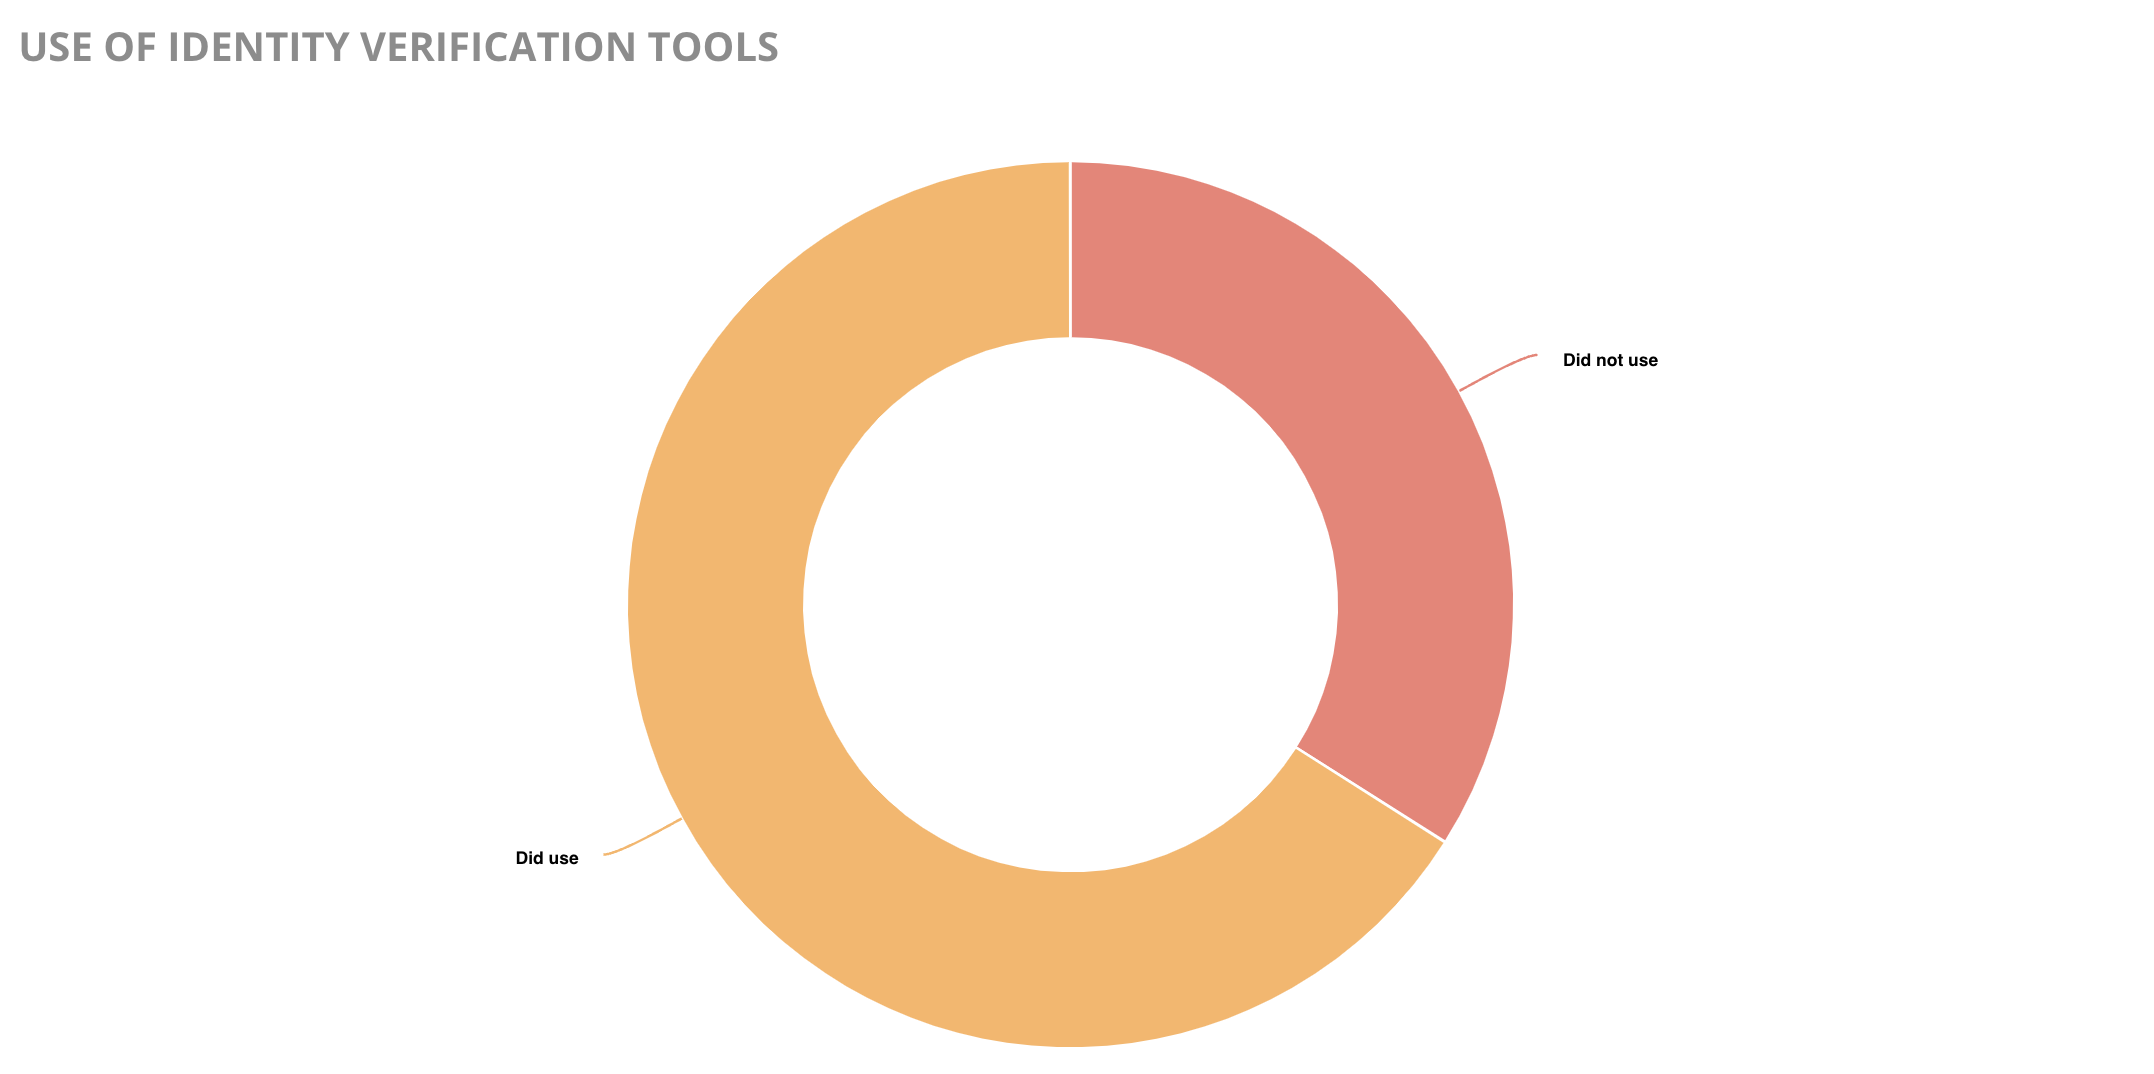
Unfortunately, this meant they sacrificed revenue recovery in exchange for lower cart abandonment rates and fewer false positives (legitimate purchases that are incorrectly flagged as fraud).
In the last few years, Visa widened the acceptable compelling evidence requirements for reason code 10.4 (Other Fraud – Card Absent Environment). Now chargeback responses need to contain evidence that proves the cardholder’s identity was verified. This can be done with positive matches from address verification service (AVS) and card security code (CVV).
Since merchants chose not to use those tools, they didn’t have the evidence needed to win.
On the other hand, merchants who excelled at collecting required compelling evidence and crafting customized responses were rewarded with impressive results. Kount helped merchants of all sizes in varying industries excel in multiple metrics — win rates, revenue recovery, return on investment, and reduction in labor hours.
Percent of Chargebacks Prevented
The most effective chargeback prevention strategies are the result of a multi-layer approach — multiple tools and actions applied at various points of the customer experience.
In 2021, all study participants had access to at least one chargeback prevention solution: analytics. Data analysis helps reveal the underlying cause for chargebacks so issues can be solved at their source. Of all the solutions available, analytics are the most helpful at driving long-term success.
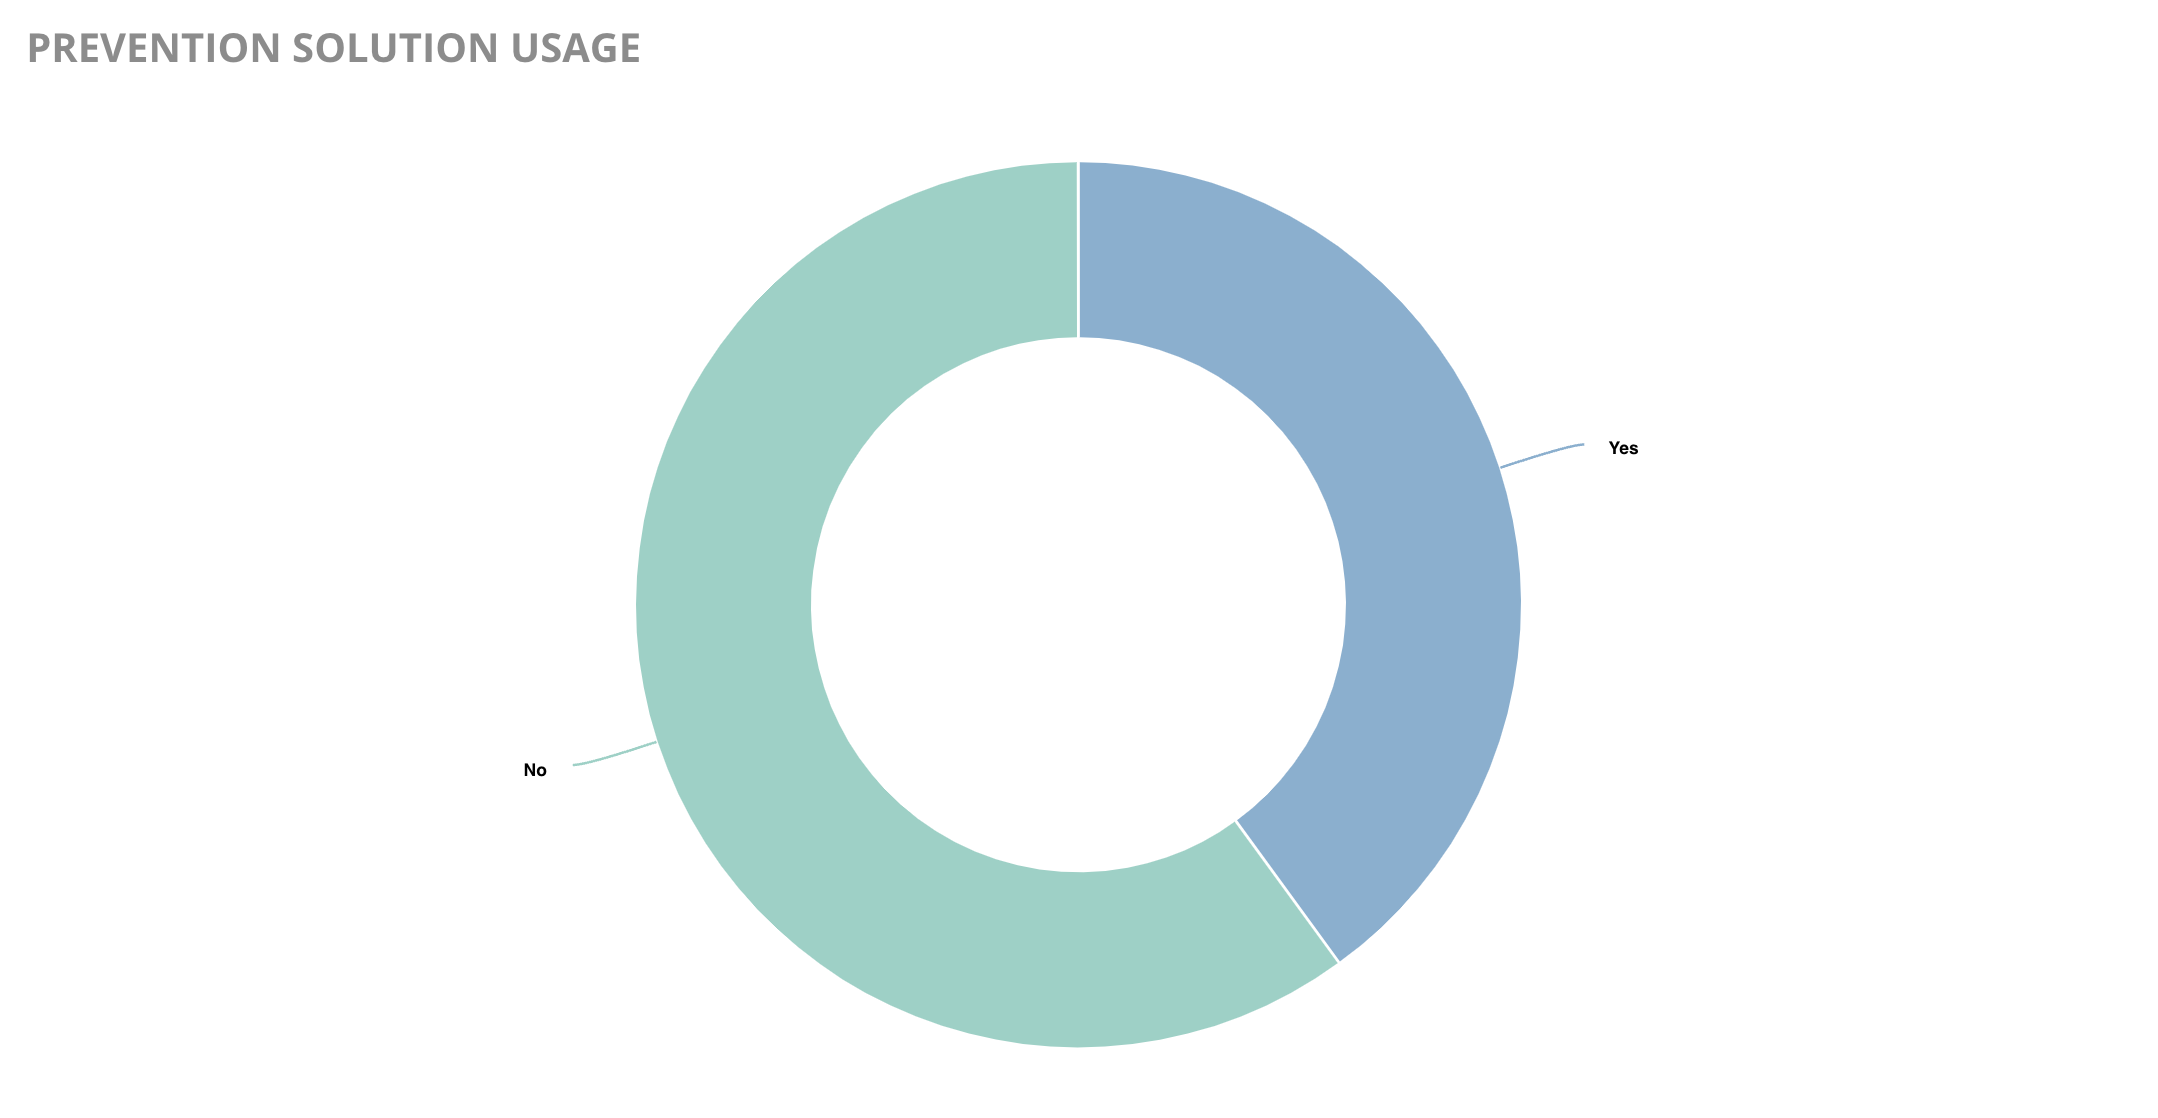
In addition to analytics, 40% of merchants chose to also use various chargeback prevention solutions including Ethoca and Verifi prevention alerts, order validation (Order Insight and Consumer Clarity), and Rapid Dispute Resolution (RDR).
Of the merchants who chose to use prevention solutions, 63.85% opted for multiple solutions. The goal was to create the most comprehensive protection strategy.
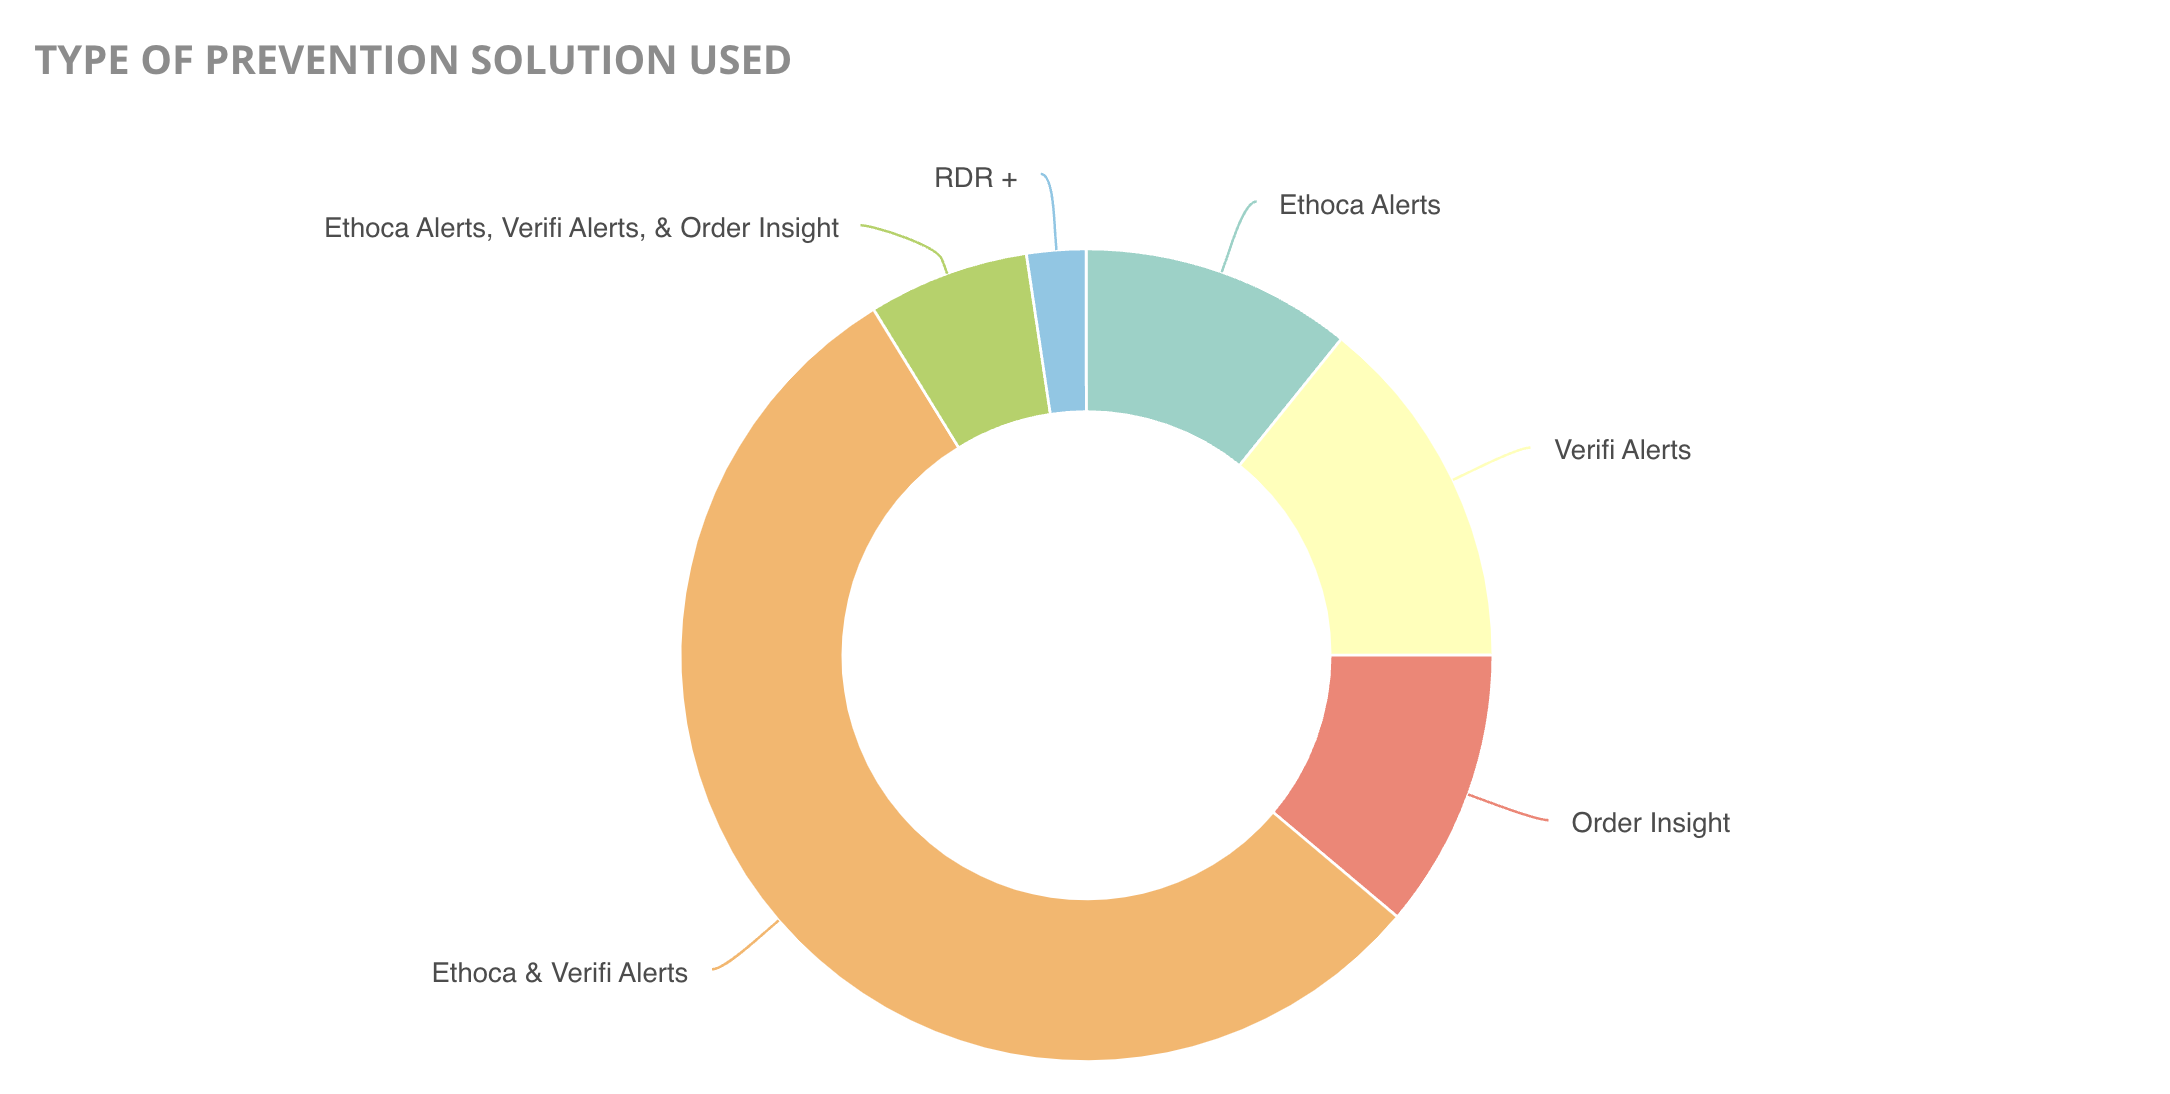
As the newest solution developed, RDR was adopted with hesitancy. All participating merchants used the solution in conjunction with other available options.
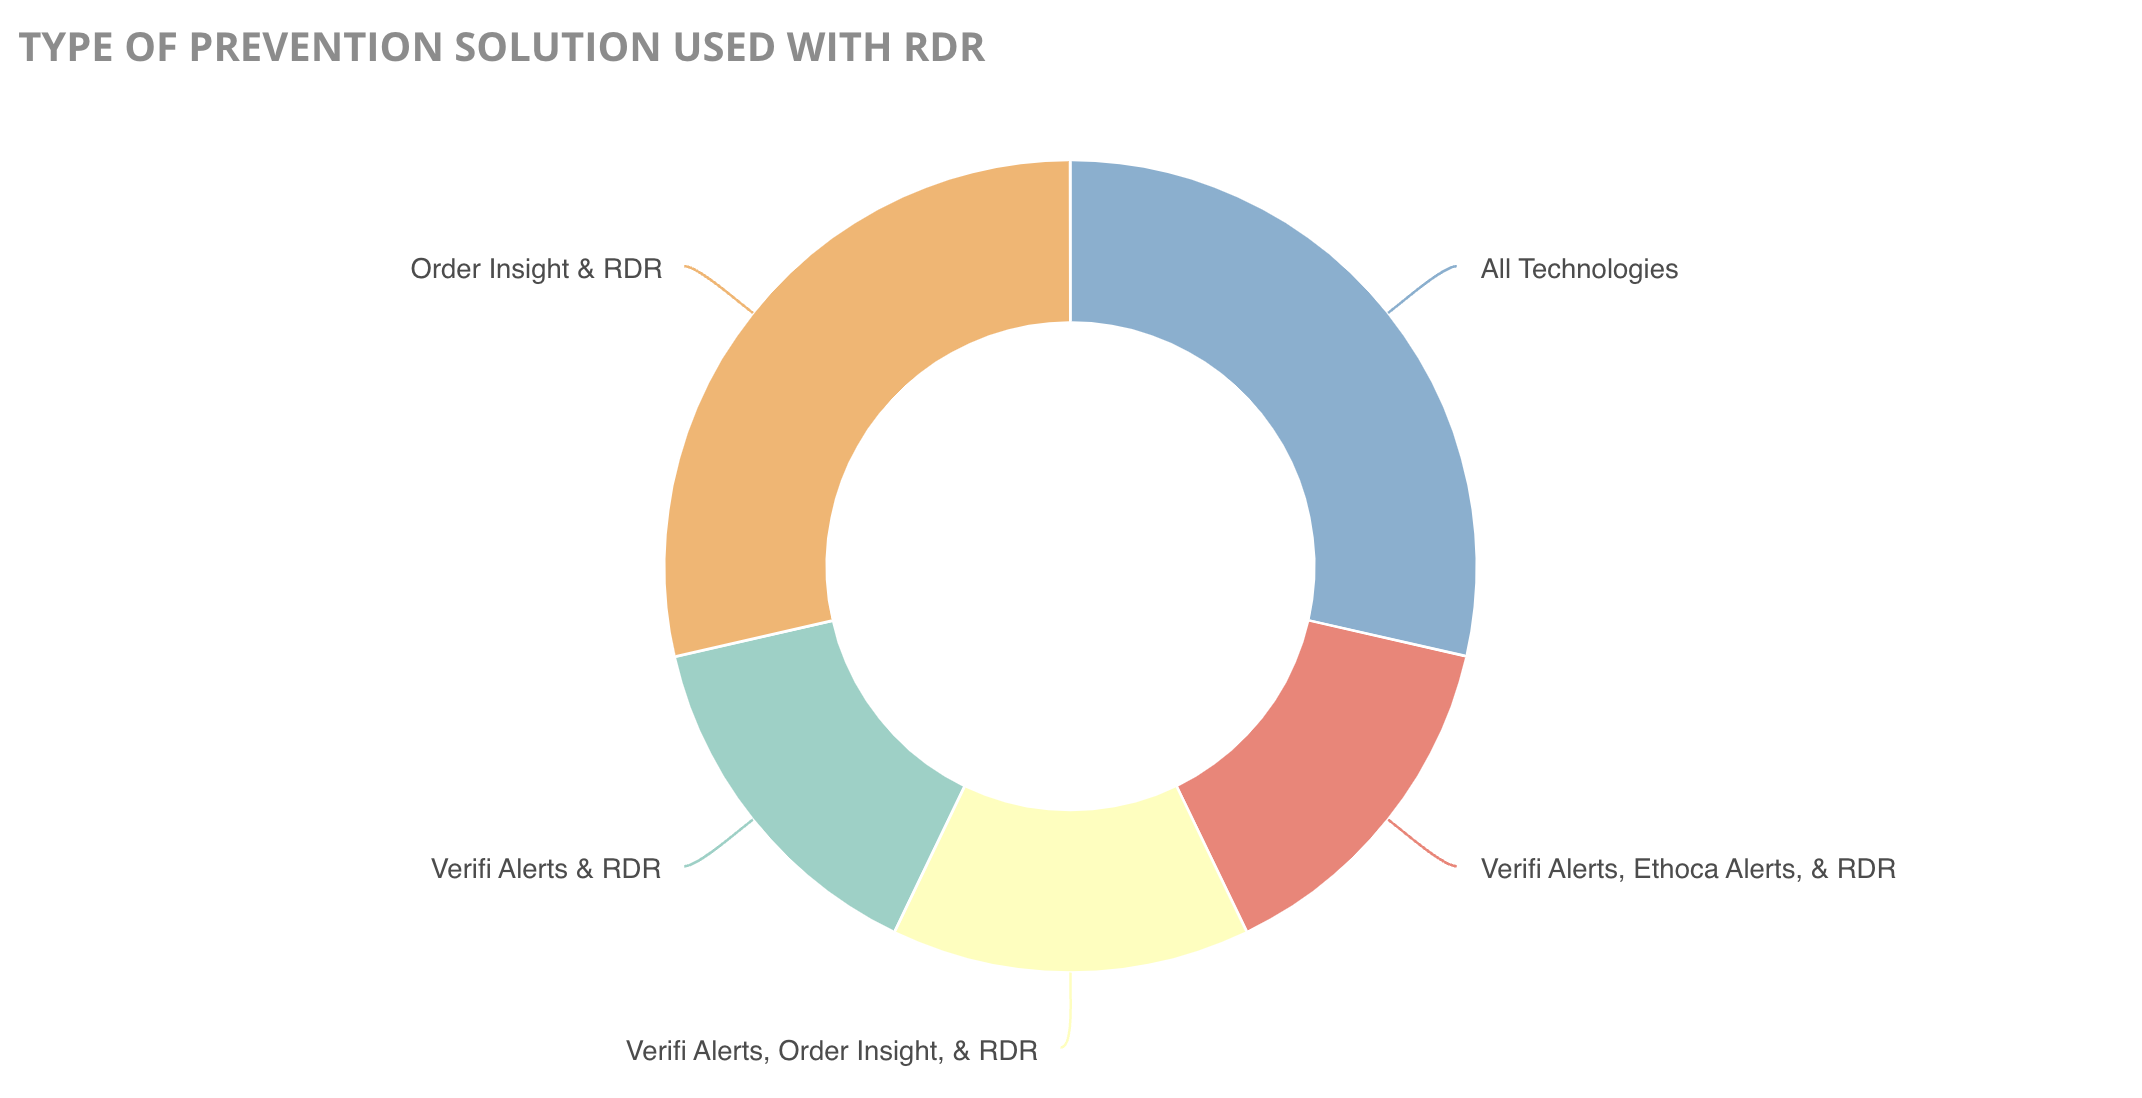
In 2021, RDR had the lowest adoption rate. However, the solution’s popularity is increasing significantly. In just the first three months of 2022, adoption had already increased 1,671%. As a result, prevention data shared in next year’s report will likely tell a very different story!
But what story does this year’s data tell?
There was a very valuable lesson to be learned in 2021: prevention initiatives must include detailed reporting and data analysis. Without complete transparency across the entire dispute lifecycle, merchants could potentially lose a lot of money.
For example, case data broken down by solution could make it seem like some solutions are more effective than others. If sheer volume was an indicator of success, data like this could be very telling.
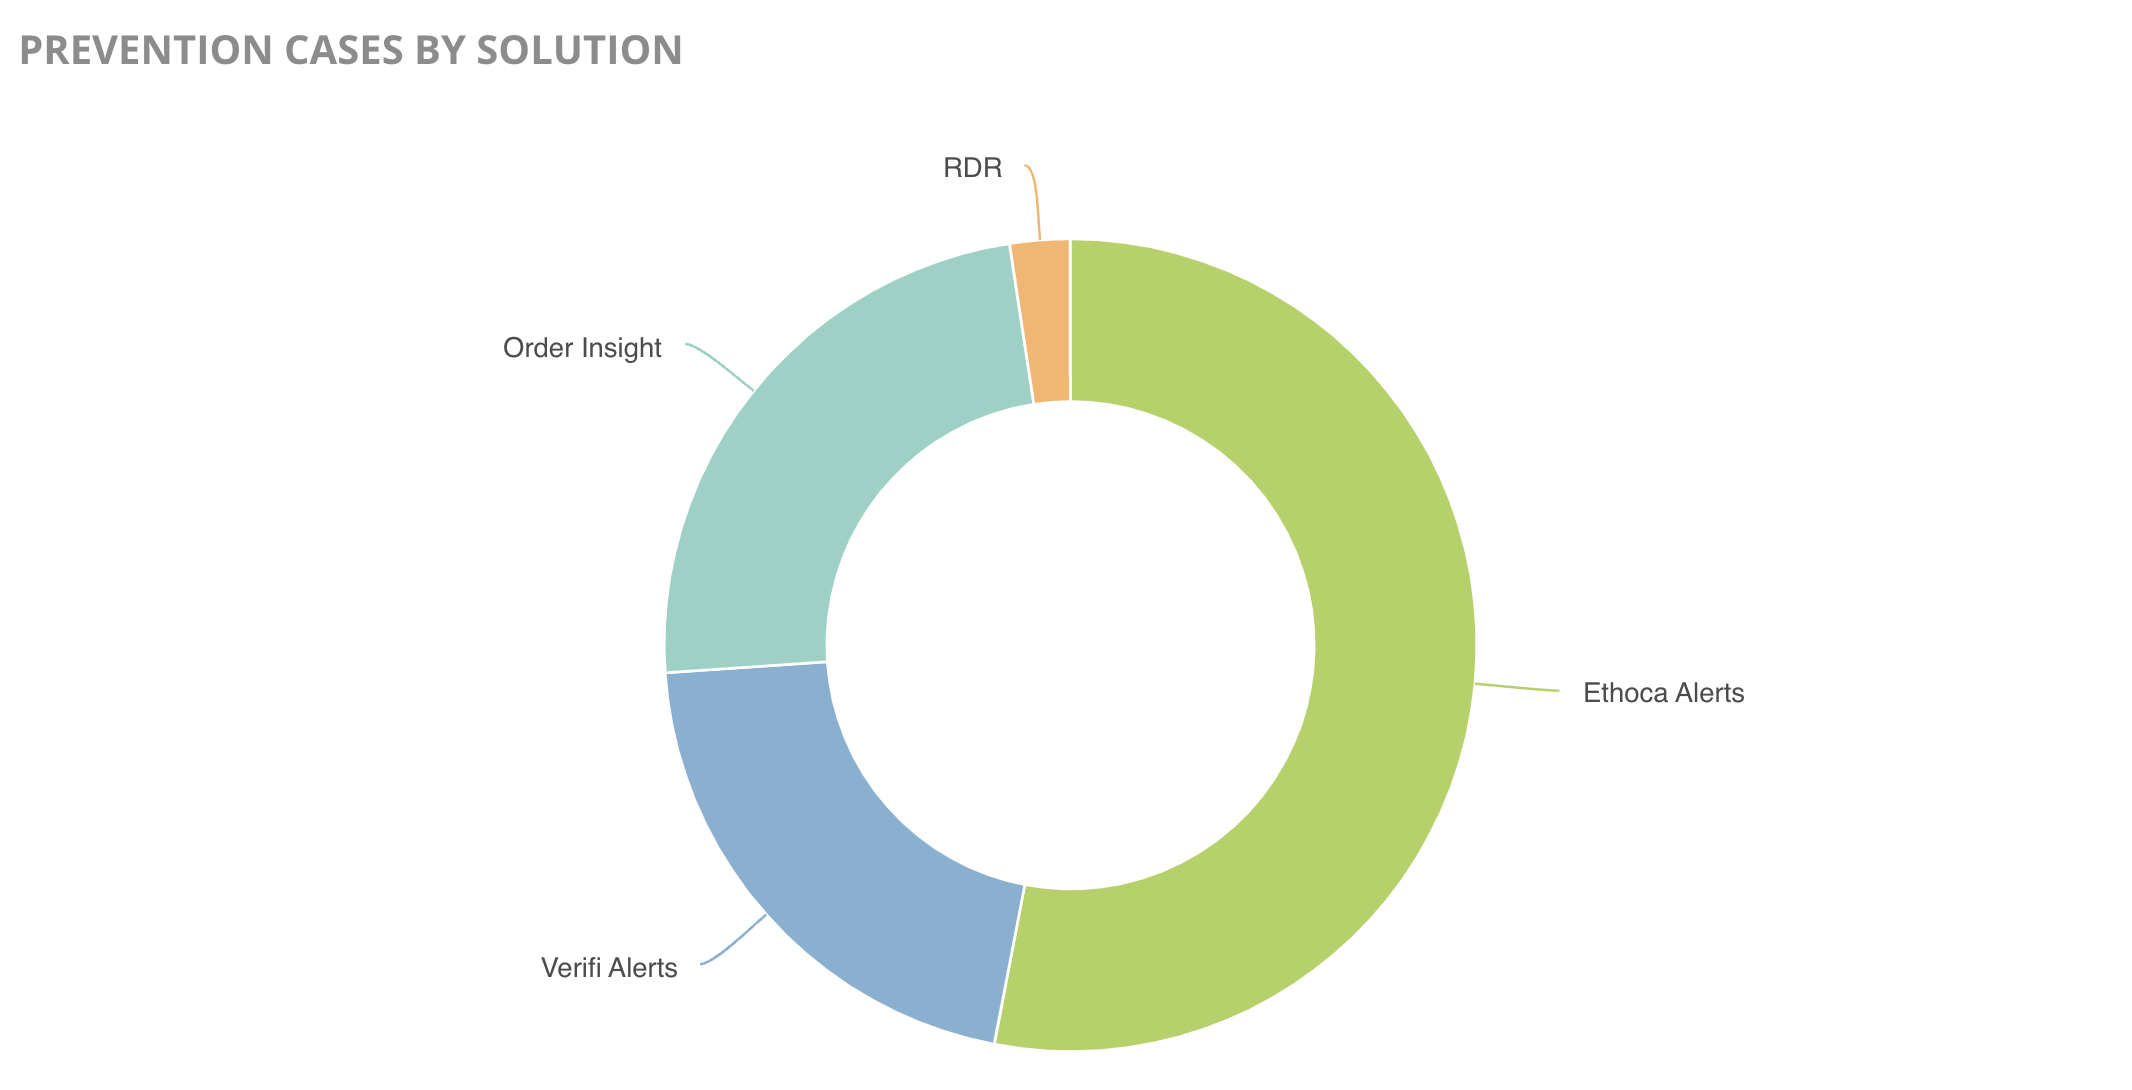
However, it’s important to review prevention data with the bigger picture in mind.
The goal of chargeback prevention solutions is to stop chargebacks from happening. And if the merchant is integrated with more than one solution, the goal is to stop chargebacks as efficiently as possible.
Therefore, data relating to overlaps — single dispute cases that involve multiple resolution attempts — and leakage — prevention attempts that are unsuccessful at stopping the chargeback — become very insightful.
For example, order validation is a relatively new prevention solution. The solution’s appeal lies in the deflection strategy: order validation resolves disputes without sacrificing revenue.
The goal is to provide the issuer with additional transaction information that can be shared with the cardholder. In theory, the new information may help the customer to recognize and understand the charge, thus making a chargeback unnecessary.
Unfortunately, the strategy doesn’t always work as planned. Only 20.39% of order validation cases successfully stopped a dispute from being filed.
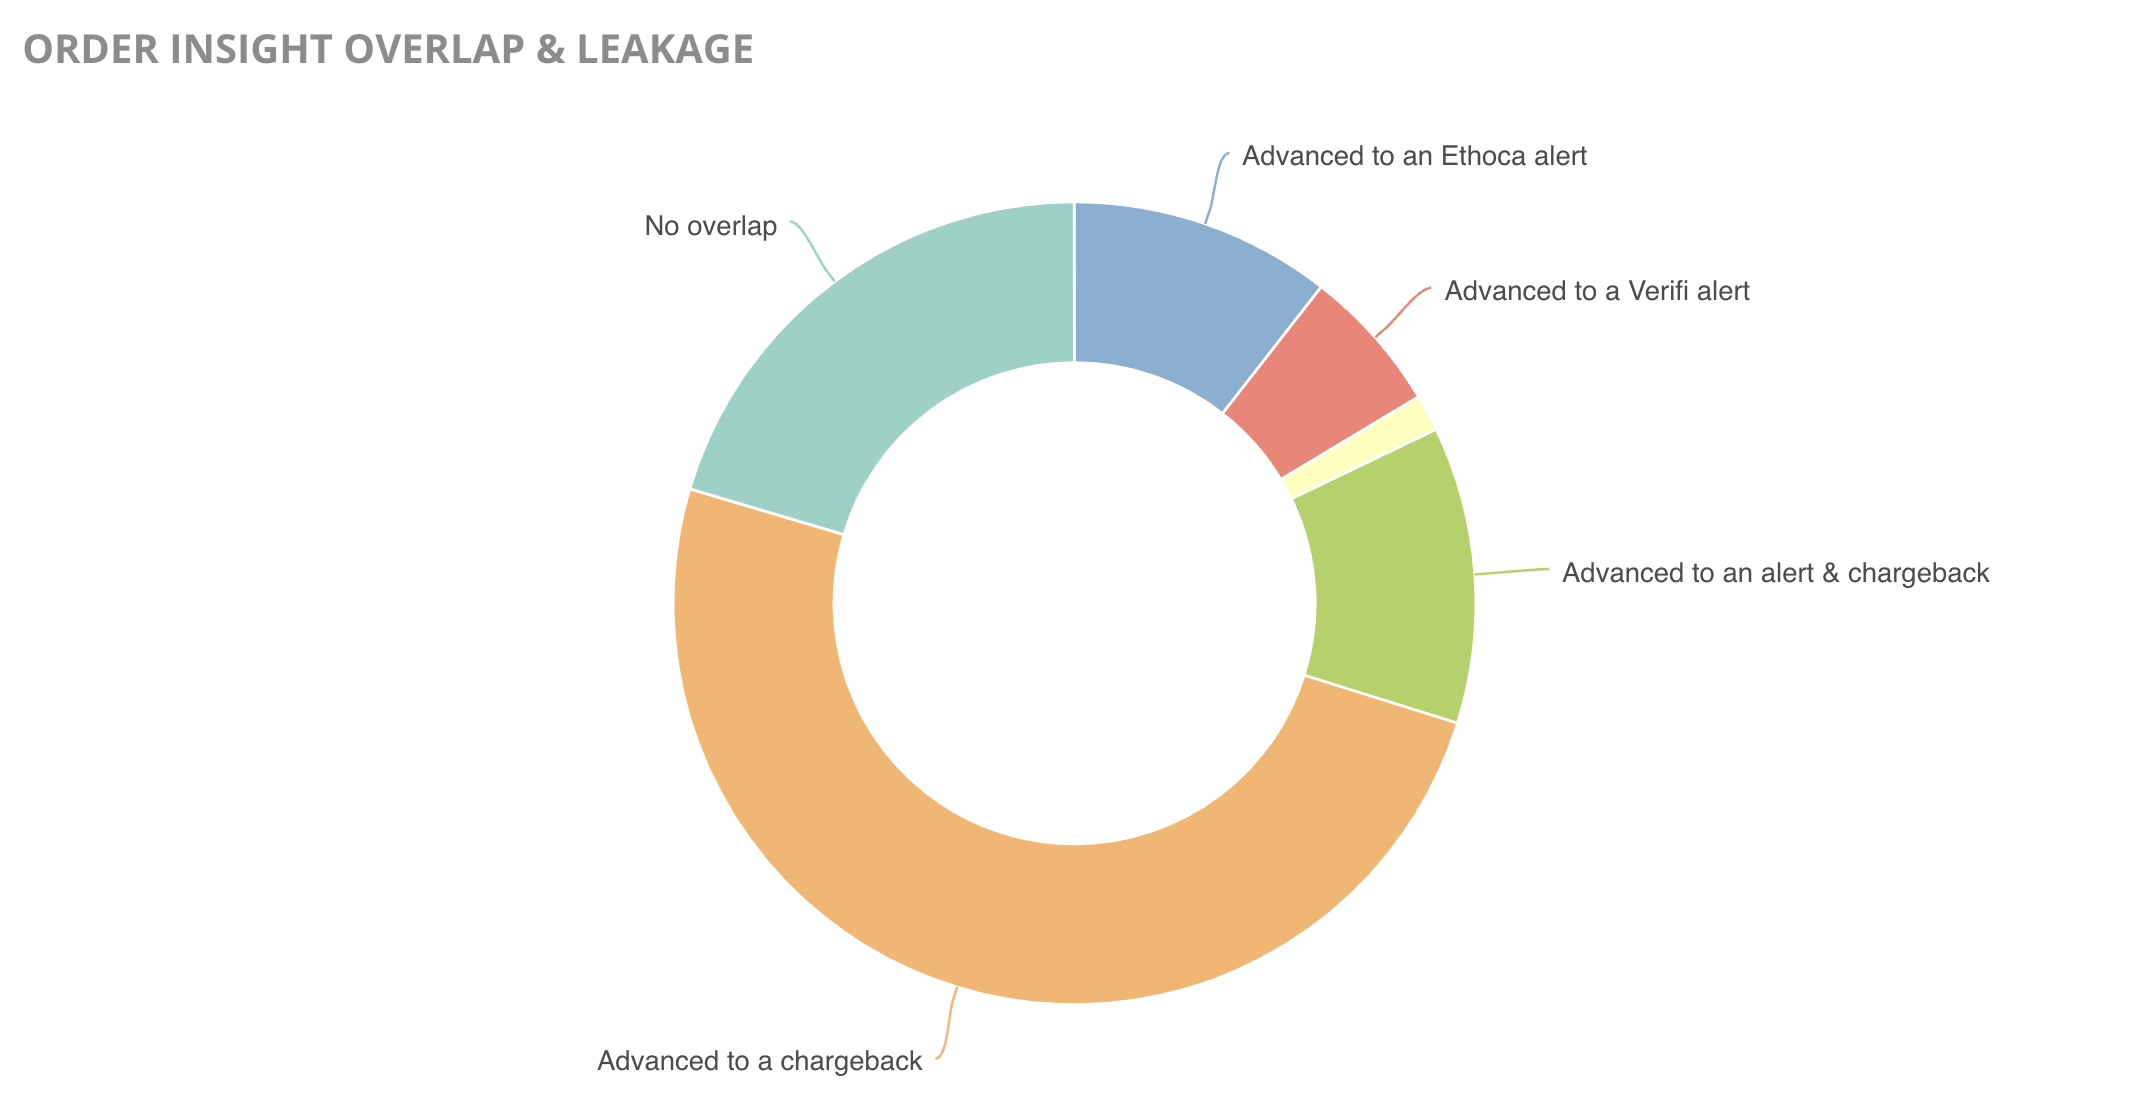
Yet the solution is still valuable — especially for high-dollar transactions. Merchants are willing to pay the extra expense for the possibility of saving the sale. And as the solution gains issuer adoption, results could improve over time.
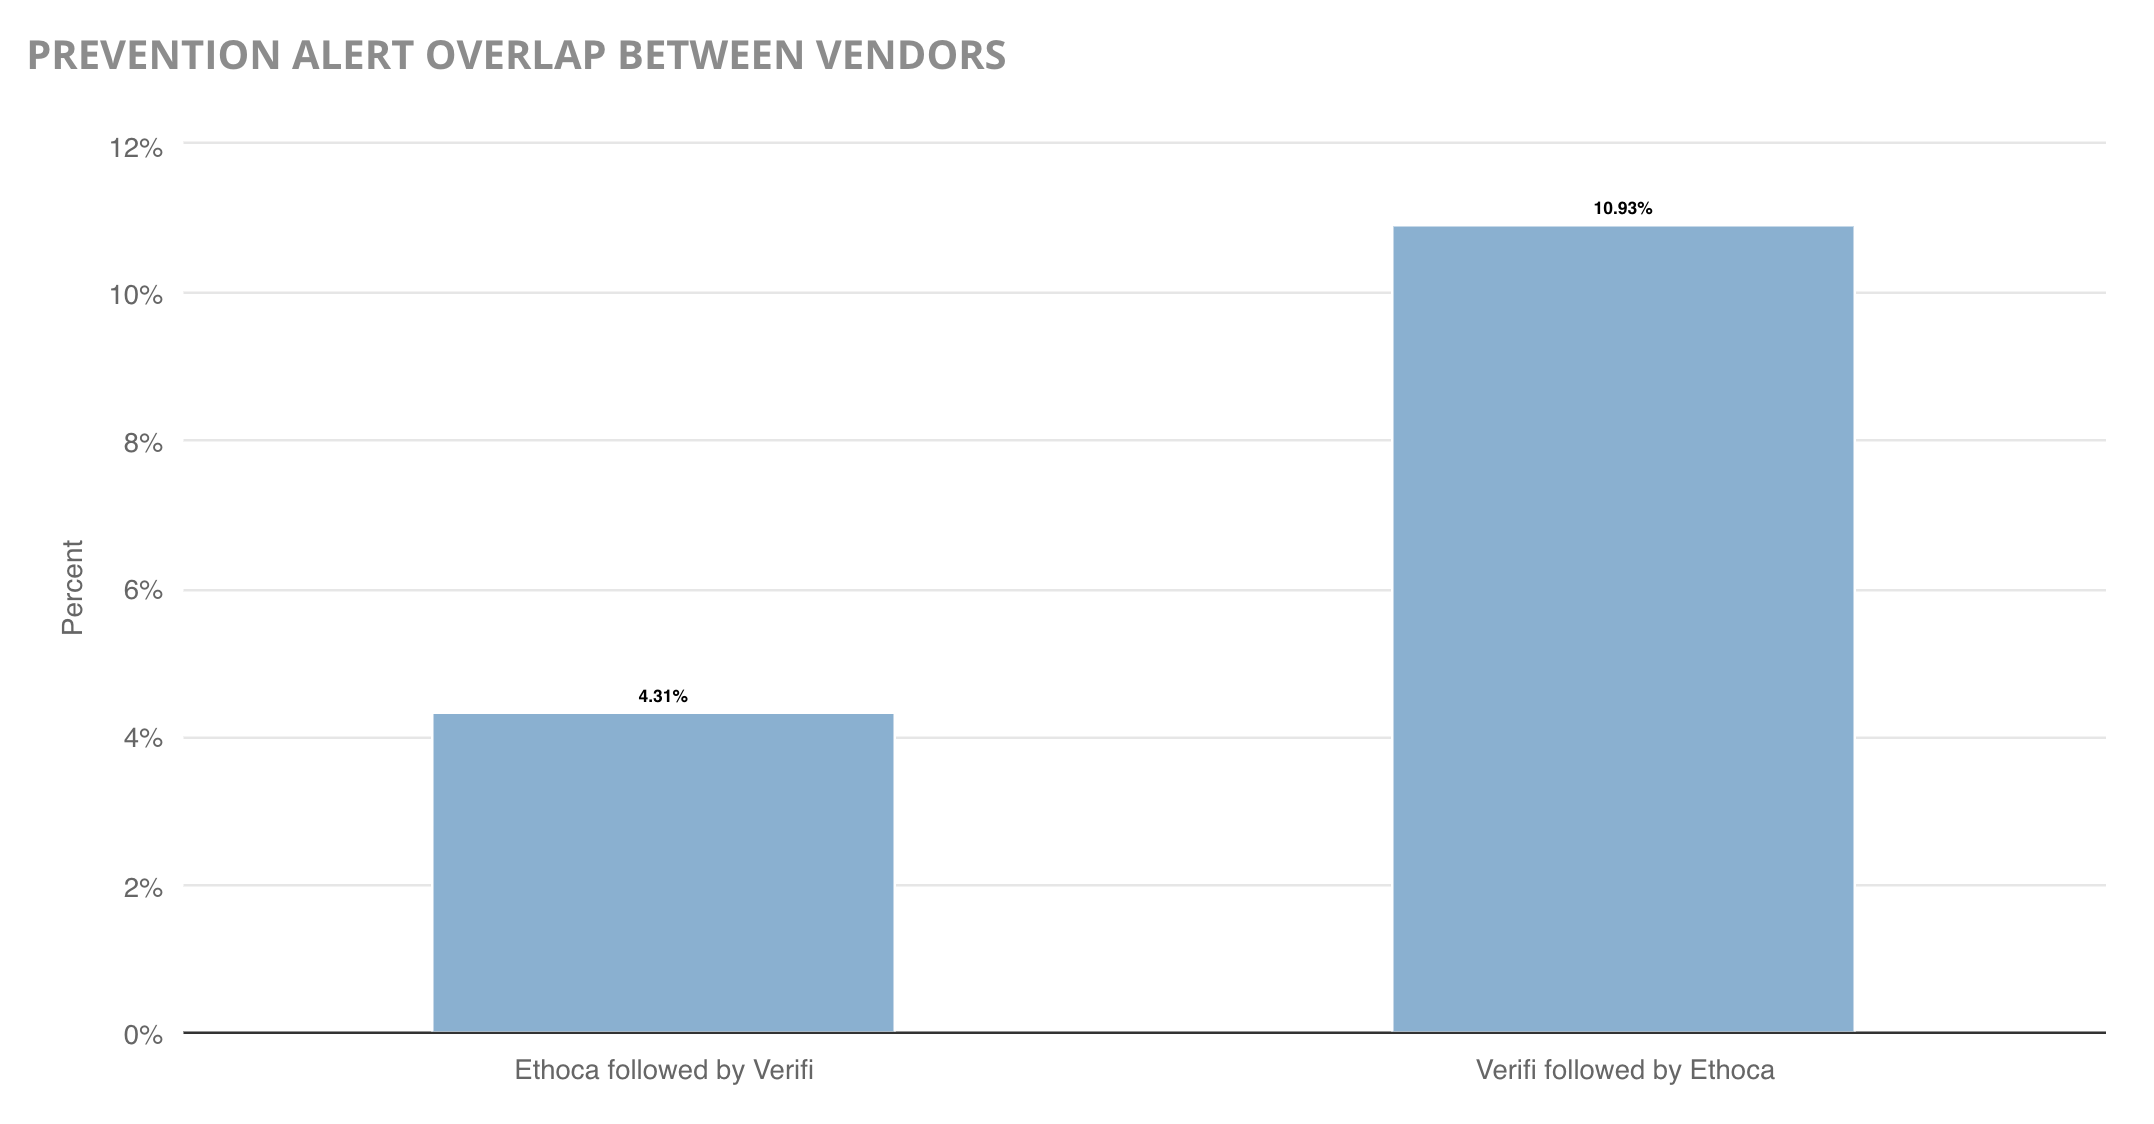
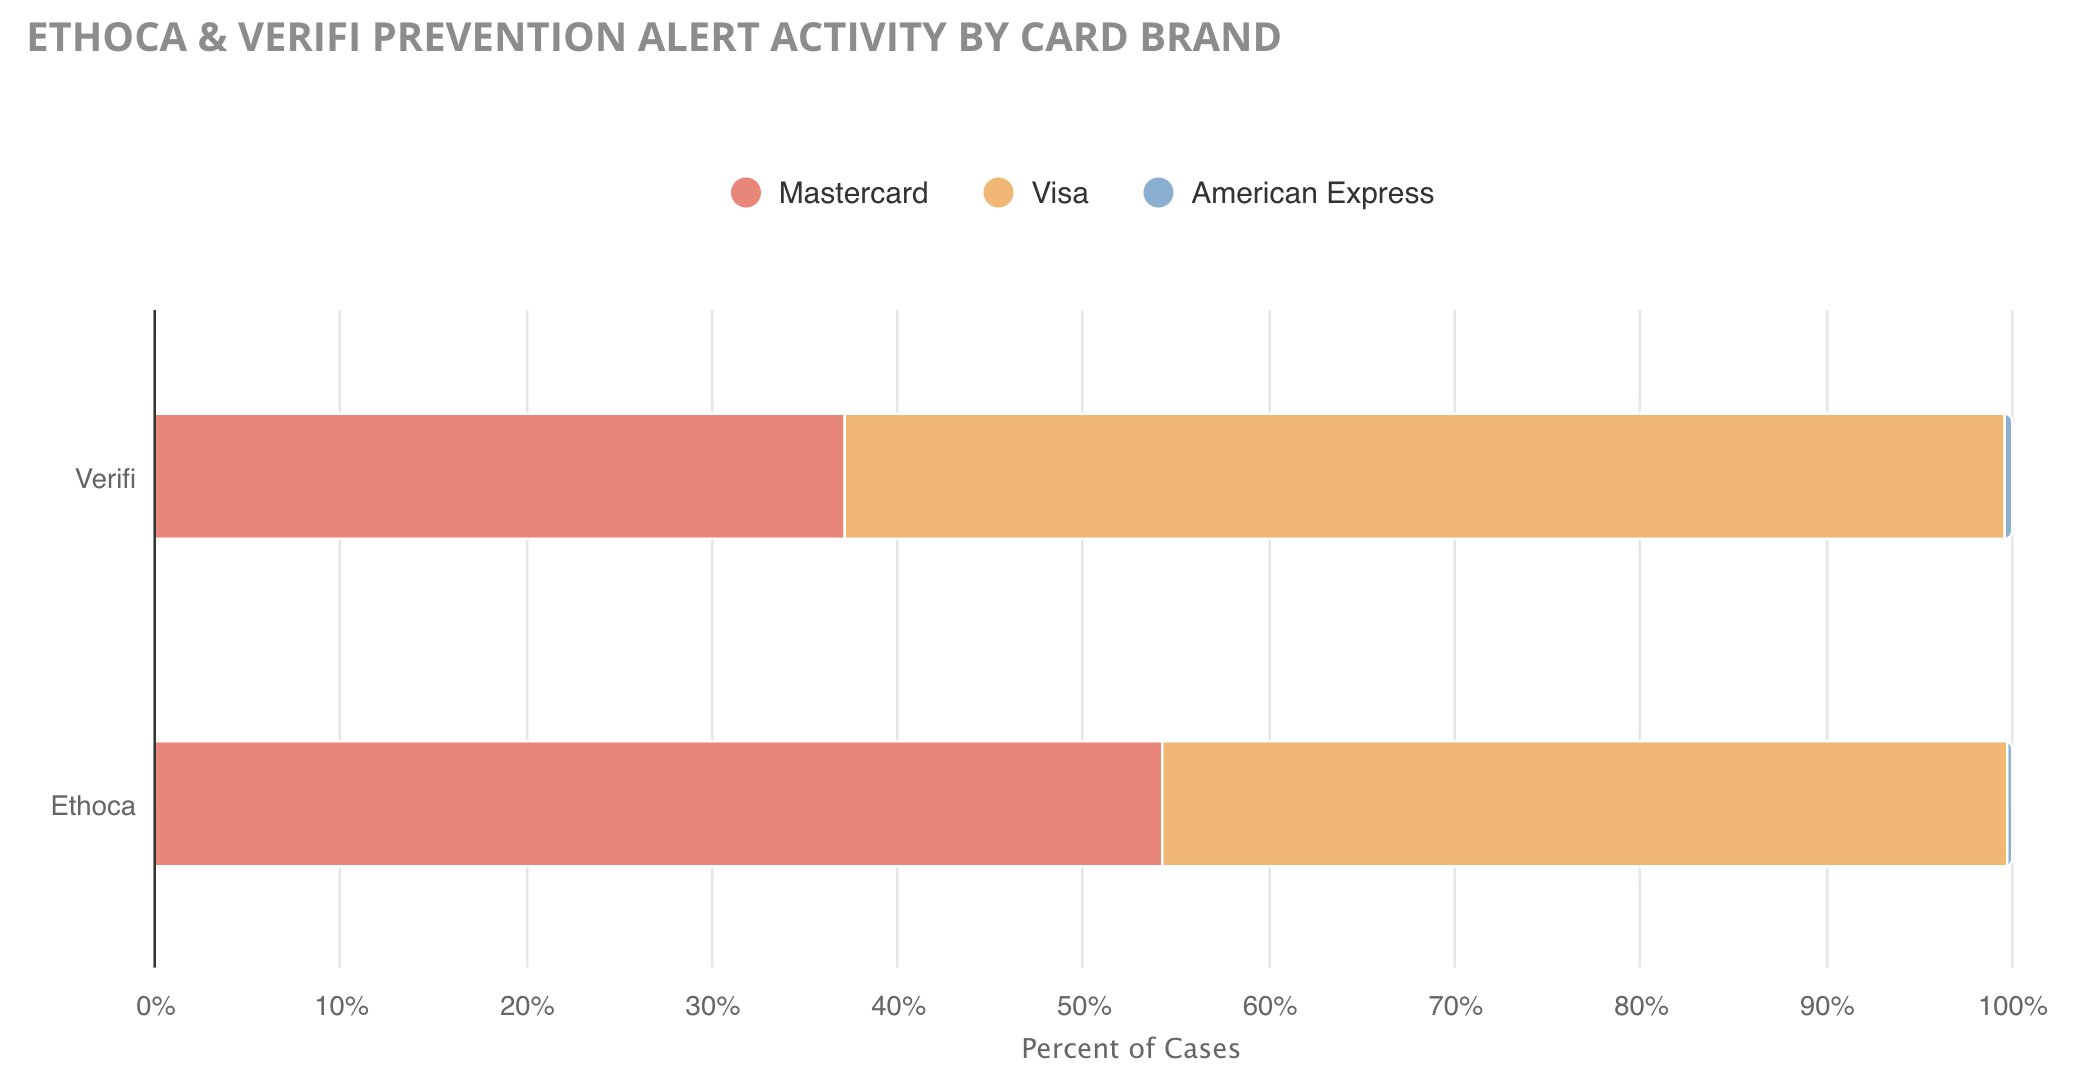
Prevention alerts were the most commonly used solution among merchants in the study; more than 86% of prevention-oriented participants used alerts in 2021.
Like order validation, prevention alert cases also suffered overlap and leakage.
Overlap between Ethoca and Verifi can happen if the issuer (cardholder’s bank) is in both vendors’ networks.
Other times, merchants experienced leakage — a prevention case that is unable to stop the chargeback.
There are several reasons why a case might receive both an alert and a chargeback. Some of the most common reasons are:
- The transaction was not refunded fast enough.
- The merchant didn’t respond to the alert (or didn’t respond within the time limit).
- The merchant only issued a partial refund.
- The merchant account used for the refund was different from the account used to process the transaction.
- The cardholder’s bank made a mistake (new hires, processing errors, technical issues, etc.).
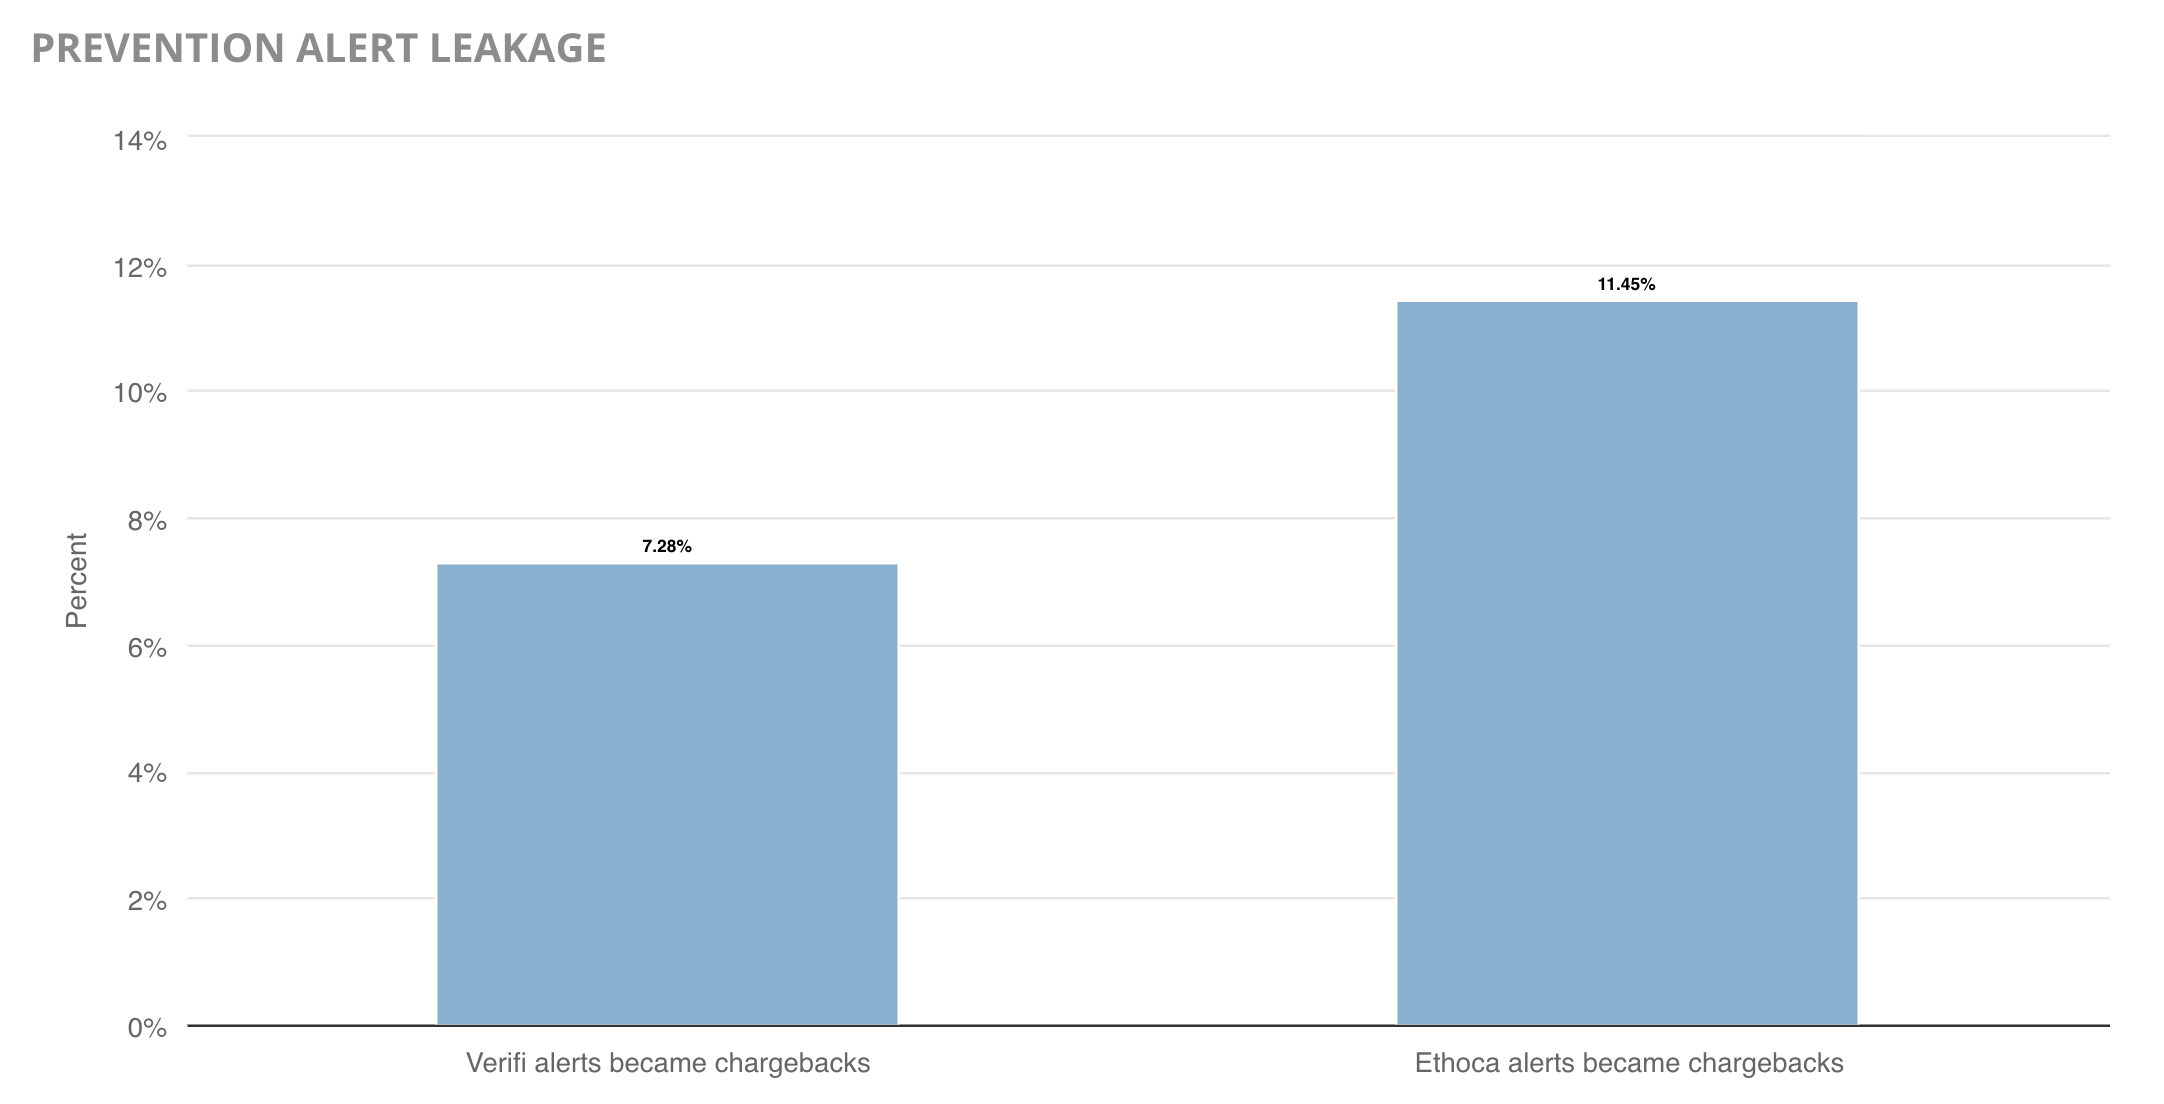
There are several plausible reasons for the discrepancies between Ethoca and Verifi overlap and leakage rates. One potential explanation could be the companies’ recent acquisitions.
In 2019, Ethoca was acquired by Mastercard and Verifi was acquired by Visa. Since then, Ethoca and Verifi alerts have experienced greater adoption.
Regardless of vendor-specific results, one truth continues year after year: chargeback prevention needs to remain a priority.
Despite the risks, chargeback prevention solutions are extremely valuable — especially since, in certain instances, merchants may be reimbursed the cost of the service if the resolution attempt is unsuccessful.
But to receive those financial credits, merchants have to know when overlap and leakage happens. That’s why it is advisable for merchants to use a single technology platform to manage the various stages of the dispute lifecycle. Accurate, complete, transparent data provides the clarity needed to ensure the maximum amount of chargebacks are prevented with the greatest efficiency and fewest costs possible.
Countries with the Highest Chargeback Rates
When expanding into new markets, merchants should evaluate the revenue potential of each individual country versus the anticipated risk.
This year’s report calculated the chargeback-to-transaction ratio for cardholder locations broken down by region.
- United States and Canada
- LAC (Latin America and the Caribbean)
- Europe
- CEEMEA (Central and Eastern Europe, Middle East, and Africa)
- AP (Asia-Pacific)
Overall, the data told a story of survival and adaptation.
In general, merchants were more cautious in 2021. Despite the fact that this year’s report included data from 165% more merchants than the previous year’s report, the number of countries involved decreased by 46.5%.
In 2020, many merchants were forced to take their businesses online — regardless of whether or not the region’s consumers were prepared for the change. As a result, many countries had chargeback ratios that were unbearably high.
In response to the increased risk, many merchants scaled back on global sales in 2021. And the initiative paid off. Nearly 96% of the countries analyzed in both 2020 and 2021 had a decrease in the average chargeback-to-transaction ratio.
As consumers became more accustomed to new sales models, technologies, societal limitations, and cardholder responsibilities, chargeback activity was more proportional to the influx in sales.
And while the decrease in risk was a welcomed relief for everyone involved, the more conservative approach did have one drawback: some countries had minimal data available for analysis.
| REGION | NUMBER OF COUNTRIES | PERCENT OF TOTAL TRANSACTIONS | PERCENT OF TOTAL CHARGEBACKS |
|---|---|---|---|
| U.S. and Canada | 2 | 92.66% | 96.9% |
| LAC | 22 | 0.14% | 0.16% |
| Europe | 20 | 5.90% | 1.49% |
| CEEMEA | 34 | 0.25% | 0.03% |
| AP | 21 | 1.06% | 1.33% |
Moreover, region-specific laws can also impact chargeback rates. The right to dispute a transaction is a federal law in the U.S. However in other countries, especially throughout the CEEMEA and AP regions, there are far fewer legally-mandated consumer protections. Since rights are less understood, chargeback rates would, understandably, be lower.
Therefore, caution should be taken when drawing inferences from the country-specific data. It may not be universally applicable or indicative of future trends. Merchants should base decisions on their own international data.
United States and Canada
The vast majority of chargebacks analyzed in this study — nearly 97% — originated in the United States or Canada.
Despite the volume of chargebacks in the U.S, merchants were able to keep risk relatively low.
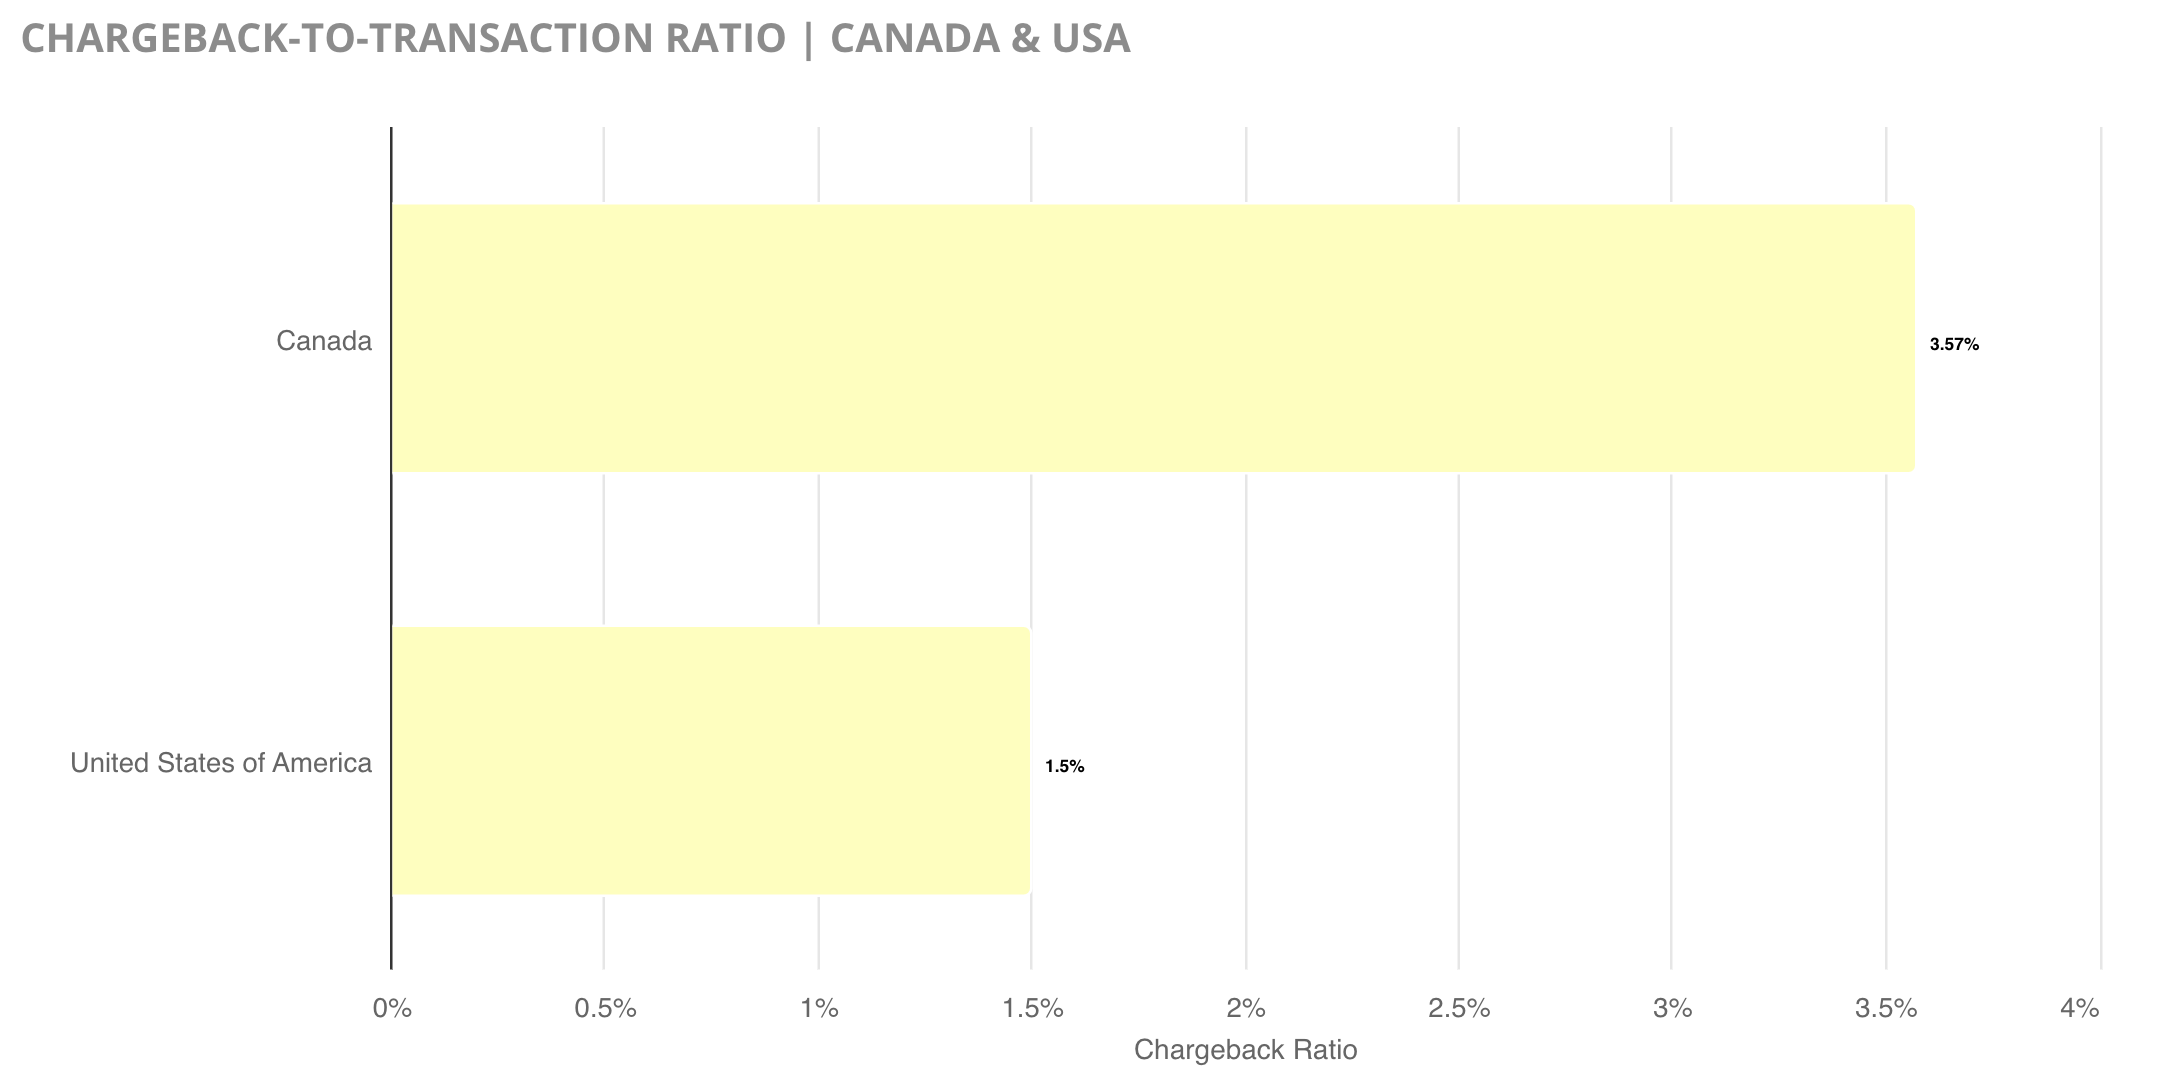
The low chargeback-to-transaction ratio in the U.S. correlated to a high rate of prevention cases in the region, which was likely the main reason risk was kept in check.
| PREVENTION SOLUTION | PERCENT OF CASES IN THE US |
|---|---|
| Verifi | 97.11% |
| Order Insight | 92.93% |
| Ethoca | 88.32% |
| RDR | 80.54% |
Ultimately, merchants’ prevention efforts paid off; the average chargeback-to-transaction ratio for the U.S. decreased 17.13% between 2020 and 2021. And despite the fact that Canada had a ratio that was higher than the norm, the overall average dropped 8.7% since 2020.
Latin America and the Caribbean
The LAC region had 6 of the 10 highest chargeback-to-transaction ratios in this year’s report.
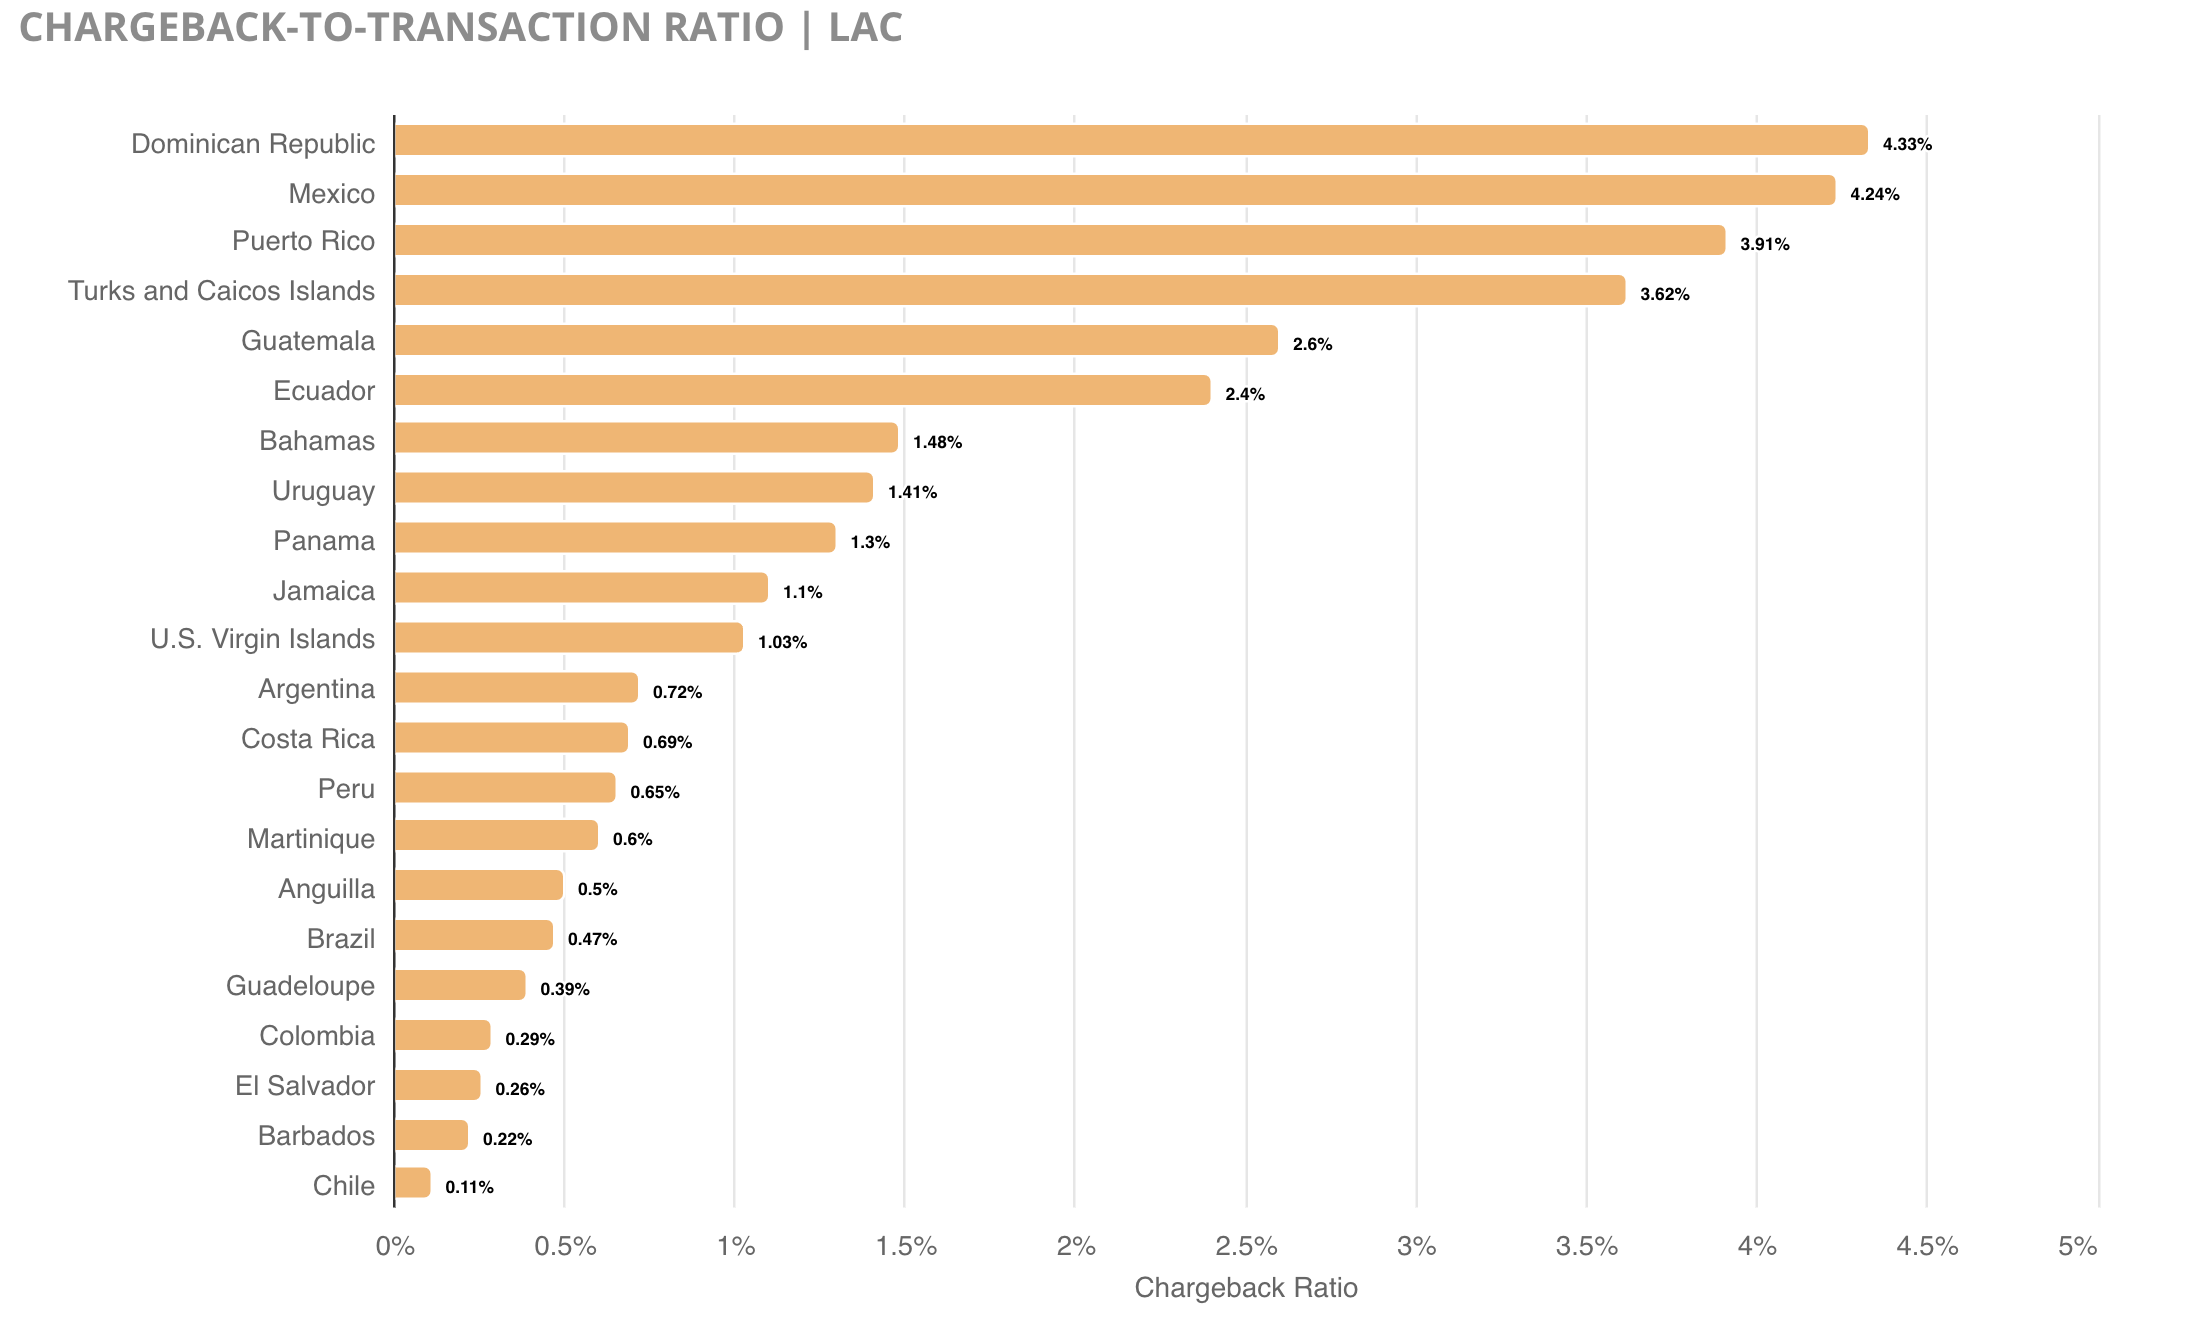
However, the higher-than-average ratios were actually a significant achievement compared to 2020. Of the countries that were included in both years’ reports, all but one saw a year-over-year decrease in the average chargeback-to-transaction ratio.
Yet, with such limited data available for analysis, long-term trends are challenging to accurately anticipate.
| COUNTRY | 2020 RATIO | 2021 RATIO | PERCENT CHANGE |
|---|---|---|---|
| Chili | 7.91% | 0.11% | 98.6% decrease |
| Brazil | 12.83% | 0.47% | 96.3% decrease |
| Colombia | 6.35% | 0.29% | 95.4% decrease |
| Barbados | 3.15% | 0.22% | 93% decrease |
| Uruguay | 17.02% | 1.41% | 91.7% decrease |
| El Salvador | 3.04% | 0.26% | 91.5% decrease |
| Argentina | 4.33% | 0.72% | 83.4% decrease |
| Costa Rica | 4.09% | 0.69% | 83.1% decrease |
| Guatemala | 13.52% | 2.60% | 80.8% decrease |
| Peru | 2.69% | 0.65% | 75.8% decrease |
| U.S. Virgin Islands | 3.52% | 1.03% | 70.7% decrease |
| Guadeloupe | 1.13% | 0.39% | 65.5% decrease |
| Mexico | 10.65% | 4.24% | 60.2% decrease |
| Ecuador | 5.50% | 2.40% | 56.4% decrease |
| Jamaica | 1.79% | 1.10% | 38.5% decrease |
| Anguilla | 0.78% | 0.50% | 35.9% decrease |
| Panama | 1.85% | 1.30% | 29.7% decrease |
| Puerto Rico | 4.95% | 3.91% | 21.0% decrease |
| Dominican Republic | 3.93% | 4.33% | 10.2% increase |
| Bahamas | 1.50% | 1.48% | 1.3% decrease |
| Turks and Caicos Islands | 0.98% | 3.62% | 269.4% increase |
Europe
Of all the regions included in this year’s report, Europe had the lowest average chargeback-to-transaction ratio — just 0.41%.
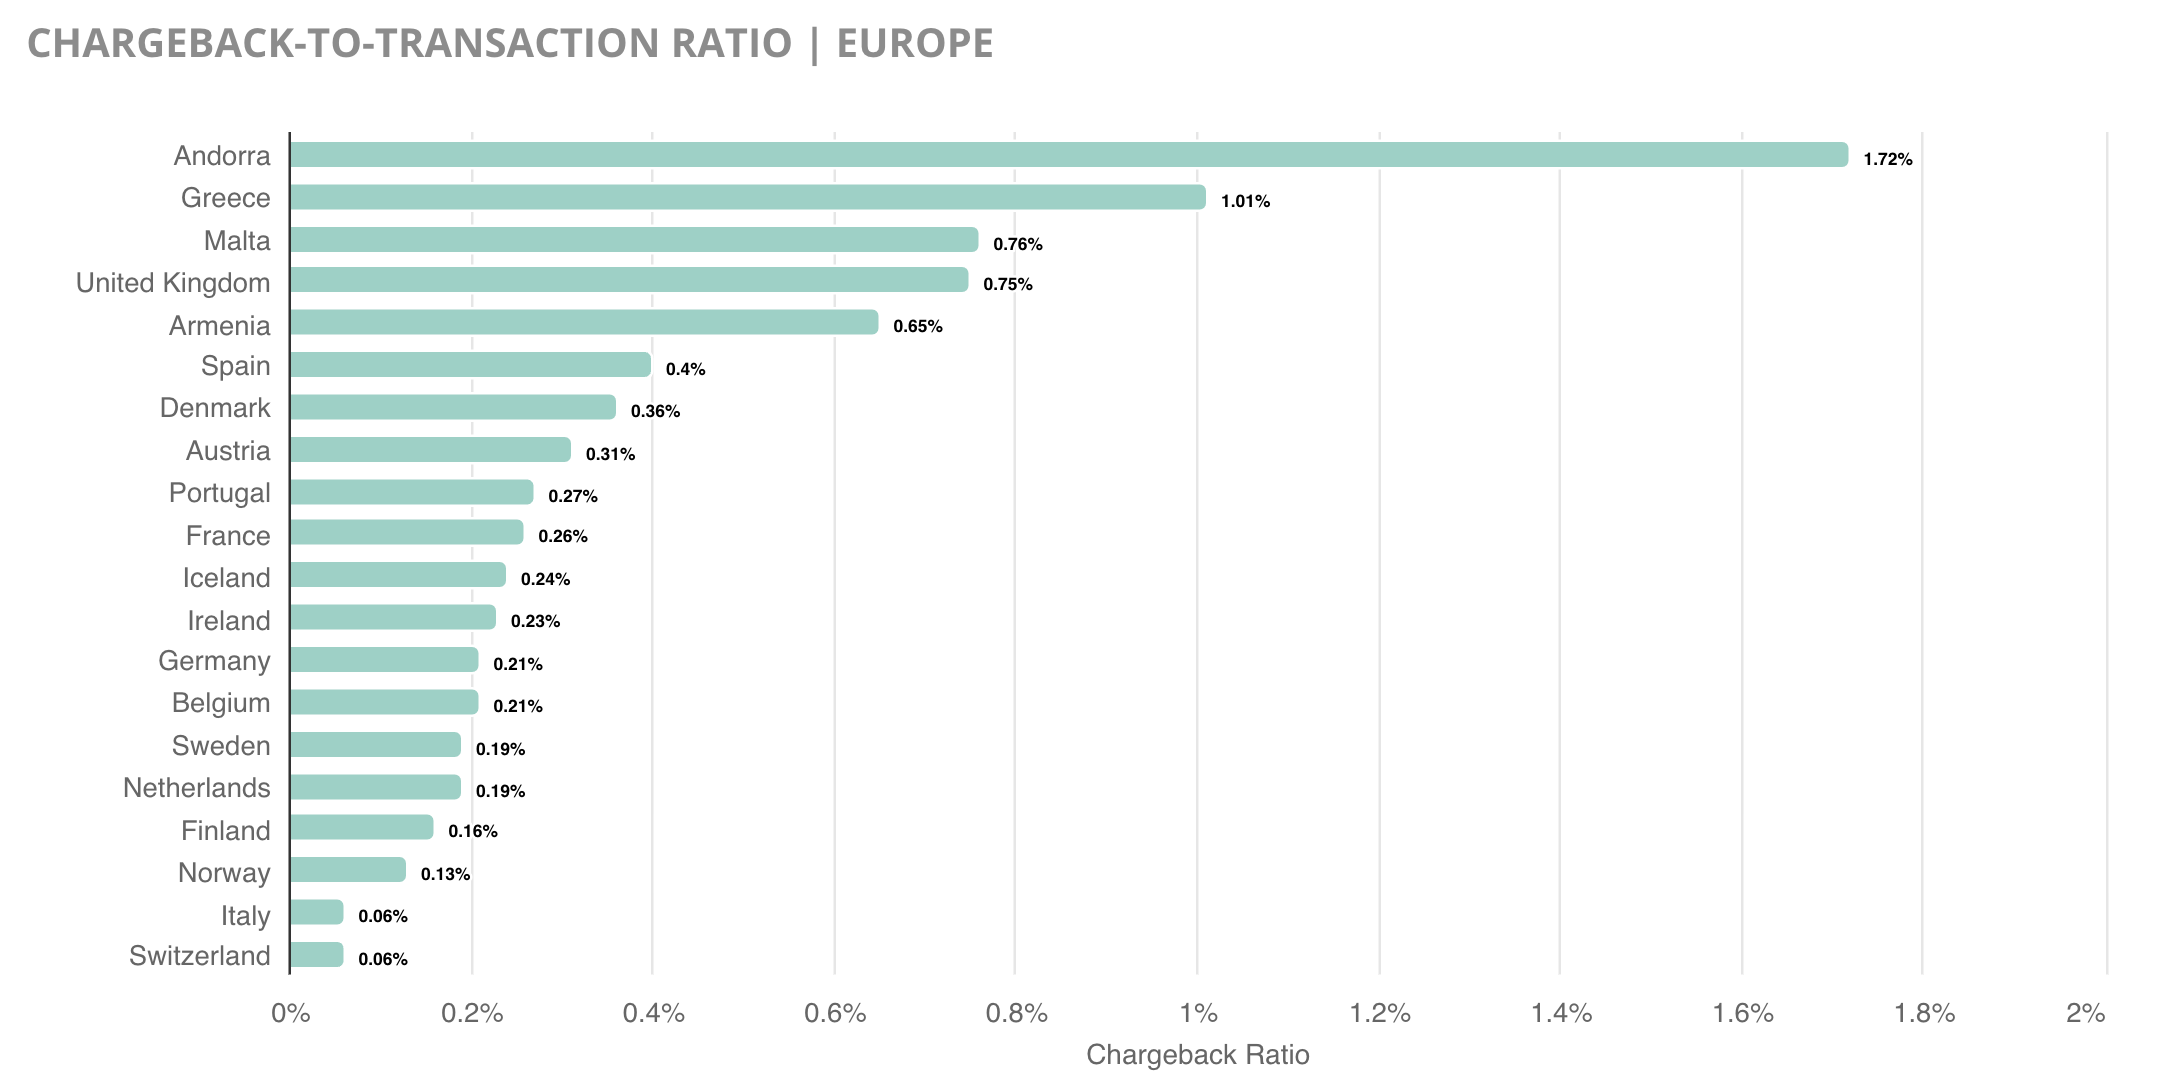
Like all the other regions, countries in Europe experienced a significant year-over-year decrease in chargeback activity.
| COUNTRY | 2020 RATIO | 2021 RATIO | PERCENT CHANGE |
|---|---|---|---|
| Switzerland | 3.21% | 0.06% | 98.1% decrease |
| Germany | 8.42% | 0.21% | 97.5% decrease |
| Belgium | 8.21% | 0.21% | 97.4% decrease |
| Netherlands | 6.78% | 0.19% | 97.2% decrease |
| Italy | 1.92% | 0.06% | 96.9% decrease |
| Portugal | 7.96% | 0.27% | 96.6% decrease |
| Spain | 11.06% | 0.40% | 96.4% decrease |
| France | 6.86% | 0.26% | 96.2% decrease |
| Ireland | 5.93% | 0.23% | 96.1% decrease |
| Austria | 4.27% | 0.31% | 92.7% decrease |
| Iceland | 3.00% | 0.24% | 92.0% decrease |
| Sweden | 1.99% | 0.19% | 90.5% decrease |
| Norway | 1.30% | 0.13% | 90.0% decrease |
| Finland | 1.57% | 0.16% | 89.8% decrease |
| Denmark | 2.26% | 0.36% | 84.1% decrease |
| Malta | 5.40% | 0.76% | 85.9% decrease |
| United Kingdom | 3.25% | 0.75% | 76.9% decrease |
| Greece | 4.30% | 1.01% | 76.5% decrease |
| Andorra | 6.40% | 1.72% | 73.1% decrease |
Central and Eastern Europe, Middle East, and Africa
Of all the regions included in this year’s report, CEEMEA was the largest with 34 of 99 total countries. However, the region only accounted for 0.25% of the report’s total transaction volume — and a mere 0.03% of the report’s chargeback volume.
Because the available data for this region was extremely limited, it’s challenging to make any meaningful inferences. While the data does accurately reflect activity for the last two years, it may not be a useful metric to anticipate future risk.
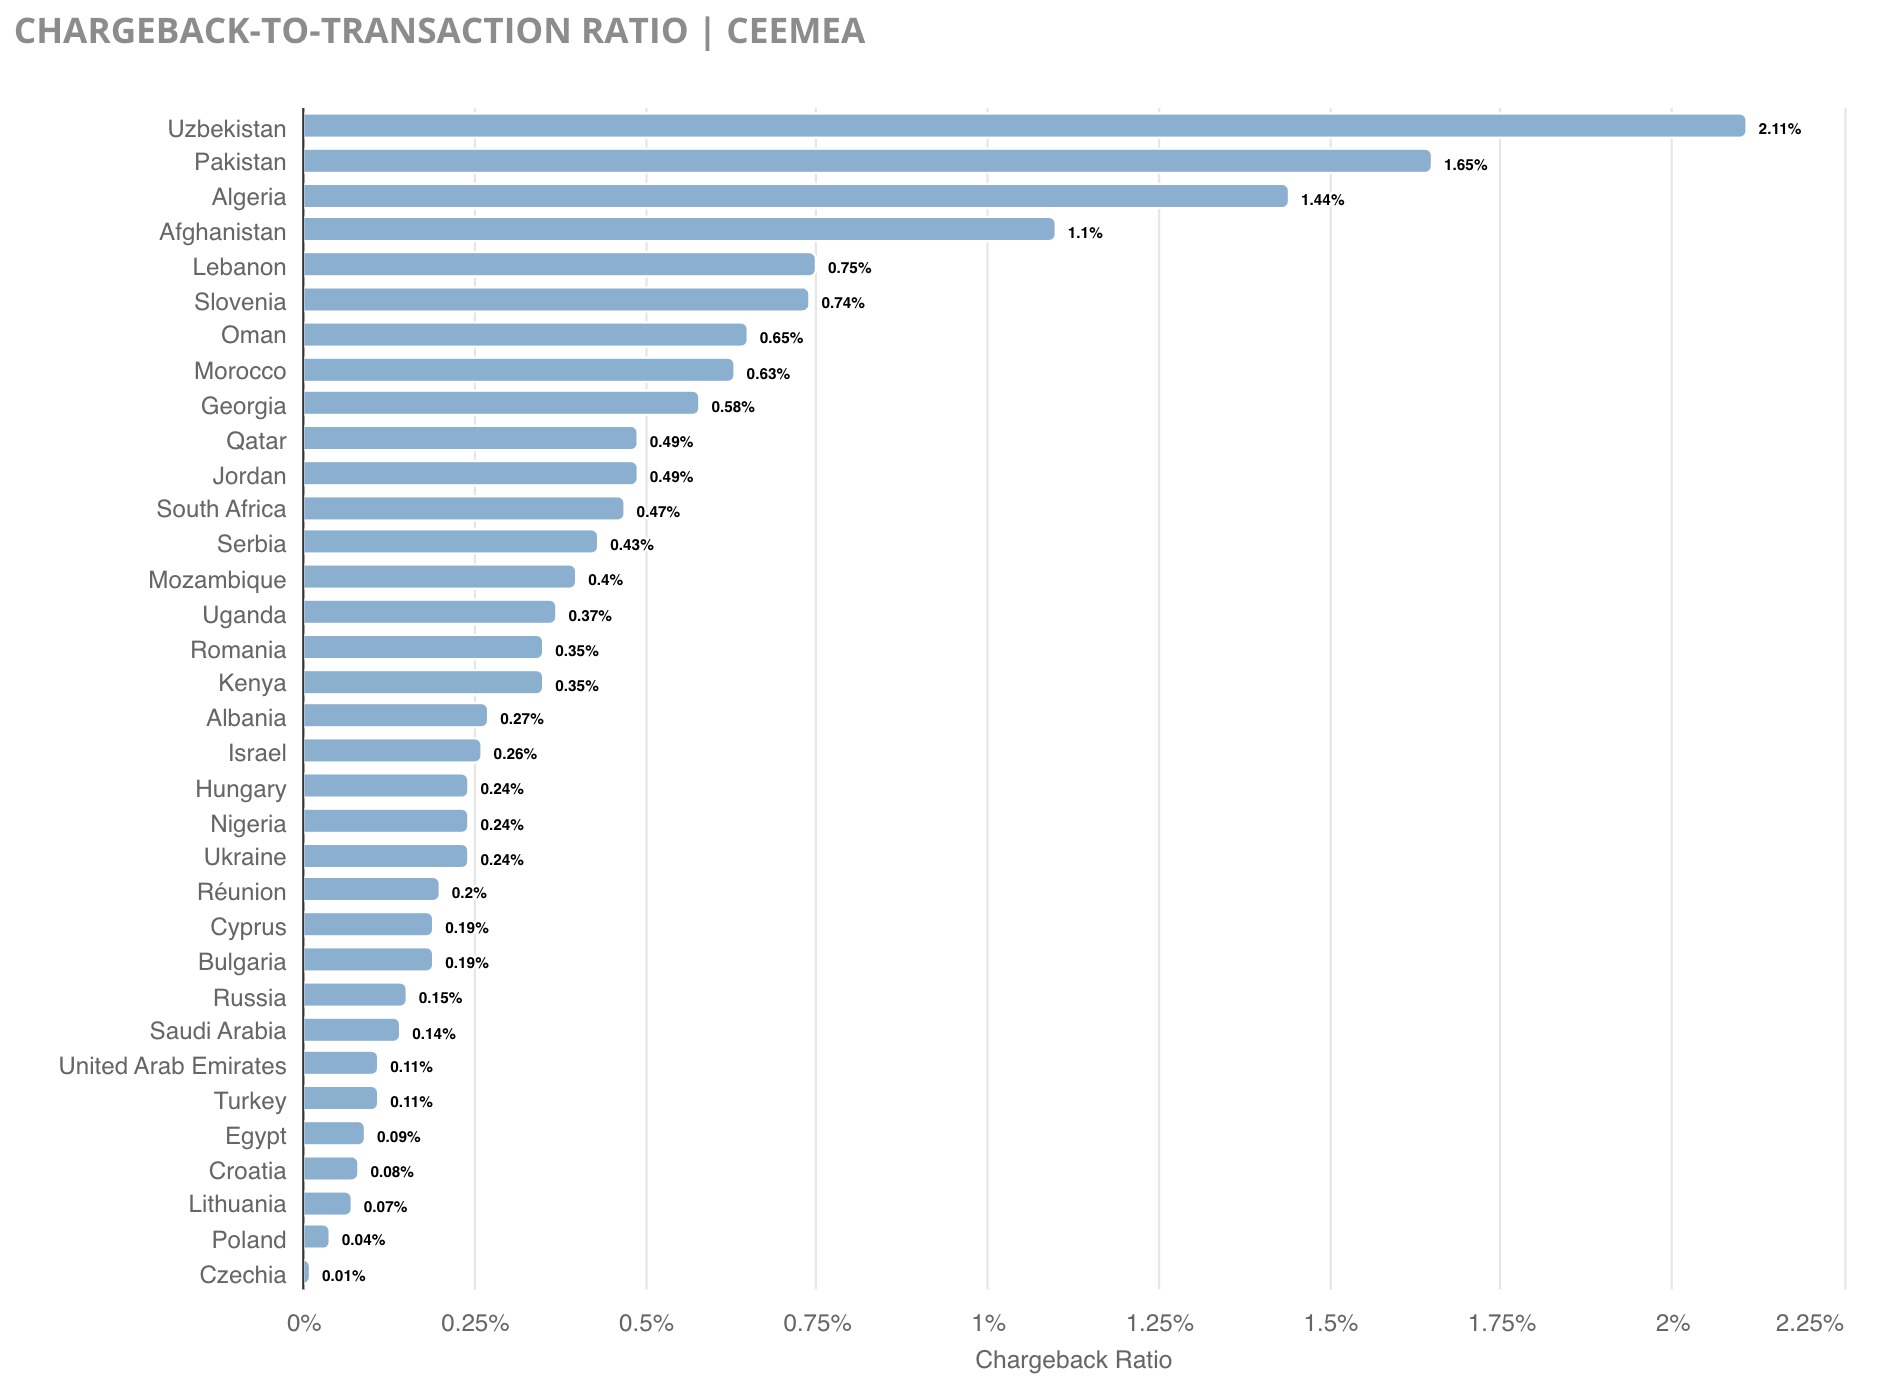
Even with limited data, it was evident that risk decreased for participating merchants in a year-over-year analysis.
| COUNTRY | 2020 RATIO | 2021 RATIO | PERCENT CHANGE |
|---|---|---|---|
| Czechia | 5.90% | 0.01% | 99.8% decrease |
| Egypt | 8.70% | 0.09% | 99% decrease |
| Turkey | 7.30% | 0.11% | 98.5% decrease |
| Croatia | 4.66% | 0.08% | 98.3% decrease |
| Cyprus | 11.04% | 0.19% | 98.3% decrease |
| Romania | 3.95% | 0.35% | 96.6% decrease |
| Israel | 7.56% | 0.26% | 96.6% decrease |
| Jordan | 13.46% | 0.49% | 96.4% decrease |
| United Arab Emirates | 2.52% | 0.11% | 95.6% decrease |
| Kenya | 5.72% | 0.35% | 93.9% decrease |
| Poland | 0.64% | 0.04% | 93.8% decrease |
| Albania | 3.28% | 0.27% | 91.8% decrease |
| South Africa | 5.43% | 0.47% | 91.3% decrease |
| Nigeria | 2.73% | 0.24% | 91.2% decrease |
| Hungary | 2.47% | 0.24% | 91.1% decrease |
| Saudi Arabia | 1.51% | 0.14% | 90.7% decrease |
| Lebanon | 6.97% | 0.75% | 89.2% decrease |
| Serbia | 3.96% | 0.43% | 89.1% decrease |
| Réunion | 1.60% | 0.20% | 87.5% decrease |
| Qatar | 2.91% | 0.49% | 83.2% decrease |
| Ukraine | 1.23% | 0.24% | 80.5% decrease |
| Oman | 3.13% | 0.65% | 79.2% decrease |
| Morocco | 2.93% | 0.63% | 78.5% decrease |
| Bulgaria | 0.74% | 0.19% | 74.3% decrease |
| Pakistan | 6.25% | 1.65% | 73.6% decrease |
| Russian Federation | 0.56% | 0.15% | 73.2% decrease |
| Uganda | 1.33% | 0.37% | 72.2% decrease |
| Georgia | 1.96% | 0.58% | 70.4% decrease |
| Algeria | 3.46% | 1.44% | 58.4% decrease |
| Afghanistan | 1.73% | 1.10% | 36.4% decrease |
| Slovenia | 1.05% | 0.74% | 29.5% decrease |
| Uzbekistan | 1.35% | 2.11% | 56.3% increase |
Asia-Pacific
The Asia-Pacific region had only 2 of the top 10 highest chargeback-to-transaction ratios — a relatively low count compared to LAC with 6. However, the AP region had the highest average chargeback-to-transaction ratio of all regions (1.92% compared to LAC’s 1.8%).
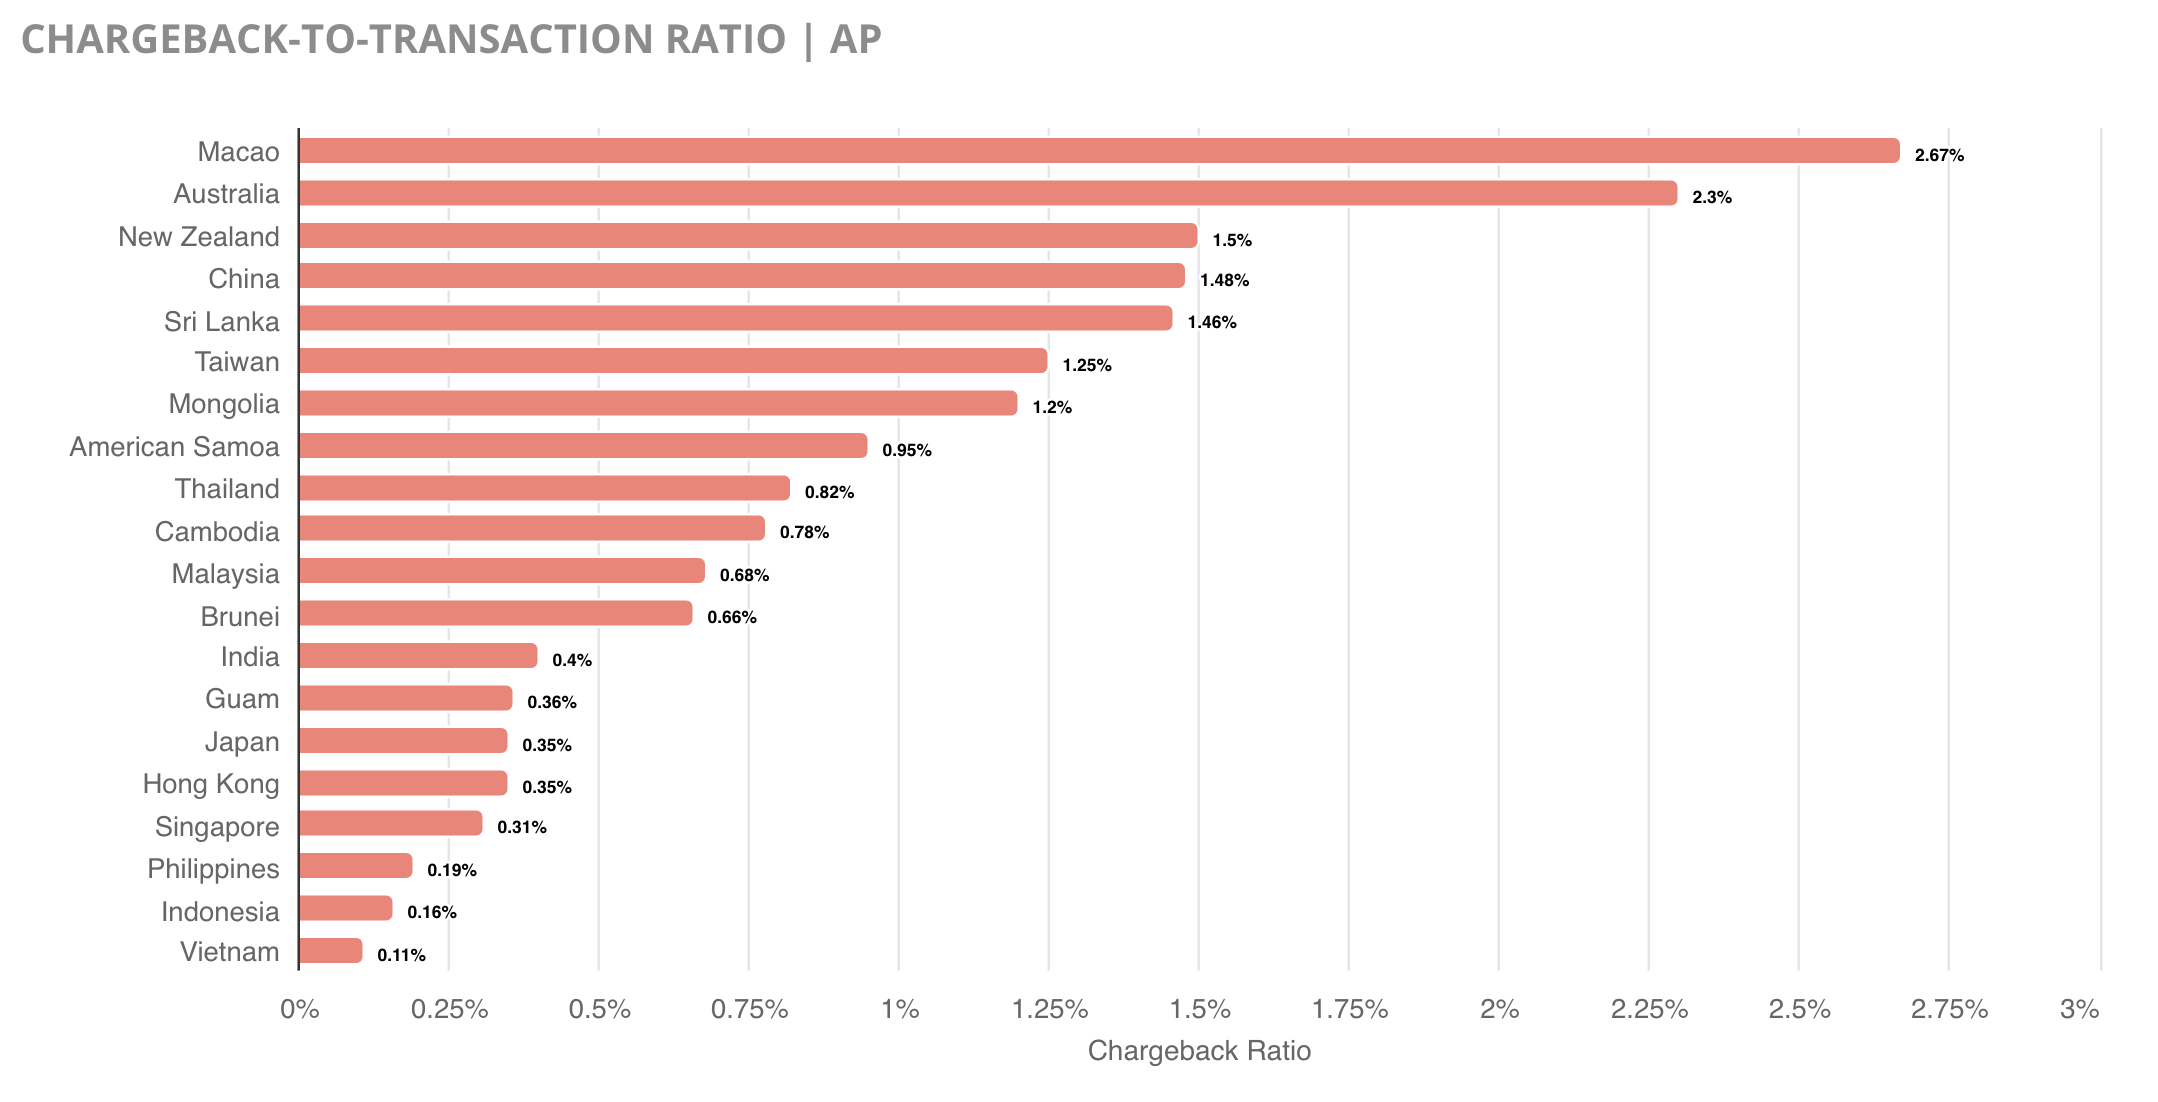
Like other regions, the available data for AP was extremely limited. Therefore, it is challenging to make meaningful inferences. However, the data does indicate that merchants experienced a decrease in risk when selling in most of these countries.
| COUNTRY | 2020 RATIO | 2021 RATIO | PERCENT CHANGE |
|---|---|---|---|
| Indonesia | 8.56% | 0.16% | 98.1% decrease |
| Philippines | 4.57% | 0.19% | 95.8% decrease |
| India | 6.79% | 0.40% | 94.1% decrease |
| Hong Kong | 5.67% | 0.35% | 93.8% decrease |
| Guam | 4.52% | 0.36% | 92.0% decrease |
| Singapore | 3.44% | 0.31% | 91.0% decrease |
| Thailand | 7.98% | 0.82% | 89.7% decrease |
| Japan | 2.78% | 0.35% | 87.4% decrease |
| Sri Lanka | 8.97% | 1.46% | 83.7% decrease |
| Malaysia | 3.43% | 0.68% | 80.2% decrease |
| Cambodia | 3.77% | 0.78% | 79.3% decrease |
| Brunei | 2.44% | 0.66% | 73.0% decrease |
| Australia | 7.15% | 2.30% | 67.8% decrease |
| Taiwan | 3.82% | 1.25% | 67.3% decrease |
| New Zealand | 4.15% | 1.50% | 63.9% decrease |
| China | 3.82% | 1.48% | 61.3% decrease |
| Macao | 4.18% | 2.67% | 36.1% decrease |
| American Samoa | 0.86% | 0.95% | 10.5% increase |
| Mongolia | 1.00% | 1.20% | 20.0% increase |
Results by Industry
New data gives unique insights for industry-specific analysis.
Reviewing the most common Mastercard and Visa reason codes with their average win rate, along with overall ROI, gives merchants a benchmark to gauge their efforts against their peers.
Kount works with dozens of industries not included in this report. Certain merchant groups with less data available for an accurate general analysis were omitted. Contact Kount for information on industries not provided here.
AVERAGE WIN RATE 53% | AVERAGE ROI 2,749% |
AVERAGE WIN RATE 70.2% | AVERAGE ROI 106% |
AVERAGE WIN RATE 72.2% | AVERAGE ROI 573% |
AVERAGE WIN RATE 53% | AVERAGE ROI 146% |
AVERAGE WIN RATE 77.4% | AVERAGE ROI 1,197% |
AVERAGE WIN RATE 74.8% | AVERAGE ROI 533% |
AVERAGE WIN RATE 60% | AVERAGE ROI 573% |
AVERAGE WIN RATE 54.1% | AVERAGE ROI 343% |
AVERAGE WIN RATE 41.9% | AVERAGE ROI 6,910% |
AVERAGE WIN RATE 72.9% | AVERAGE ROI 571% |
AVERAGE WIN RATE 57.9% | AVERAGE ROI 2,197% |
AVERAGE WIN RATE 64.5% | AVERAGE ROI 182% |
AVERAGE WIN RATE 76.9% | AVERAGE ROI 1,178% |
AVERAGE WIN RATE 46% | AVERAGE ROI 925% |
AVERAGE WIN RATE 60% | AVERAGE ROI 7,739% |
AVERAGE WIN RATE 79.3% | AVERAGE ROI 295% |
AVERAGE WIN RATE 43.7% | AVERAGE ROI 5,430% |
AVERAGE WIN RATE 42.8% | AVERAGE ROI 3,196% |
AVERAGE WIN RATE 48.7% | AVERAGE ROI 382% |
AVERAGE WIN RATE 52.9% | AVERAGE ROI 458% |
AVERAGE WIN RATE 78.5% | AVERAGE ROI 358% |
The analysis is broad, covering 21 different industries. However, if a specific industry is not available for study, alternative options are available. Check our results by product type (digital goods, physical goods, and services) and sales method (single purchases and subscriptions).
Results by Product Type
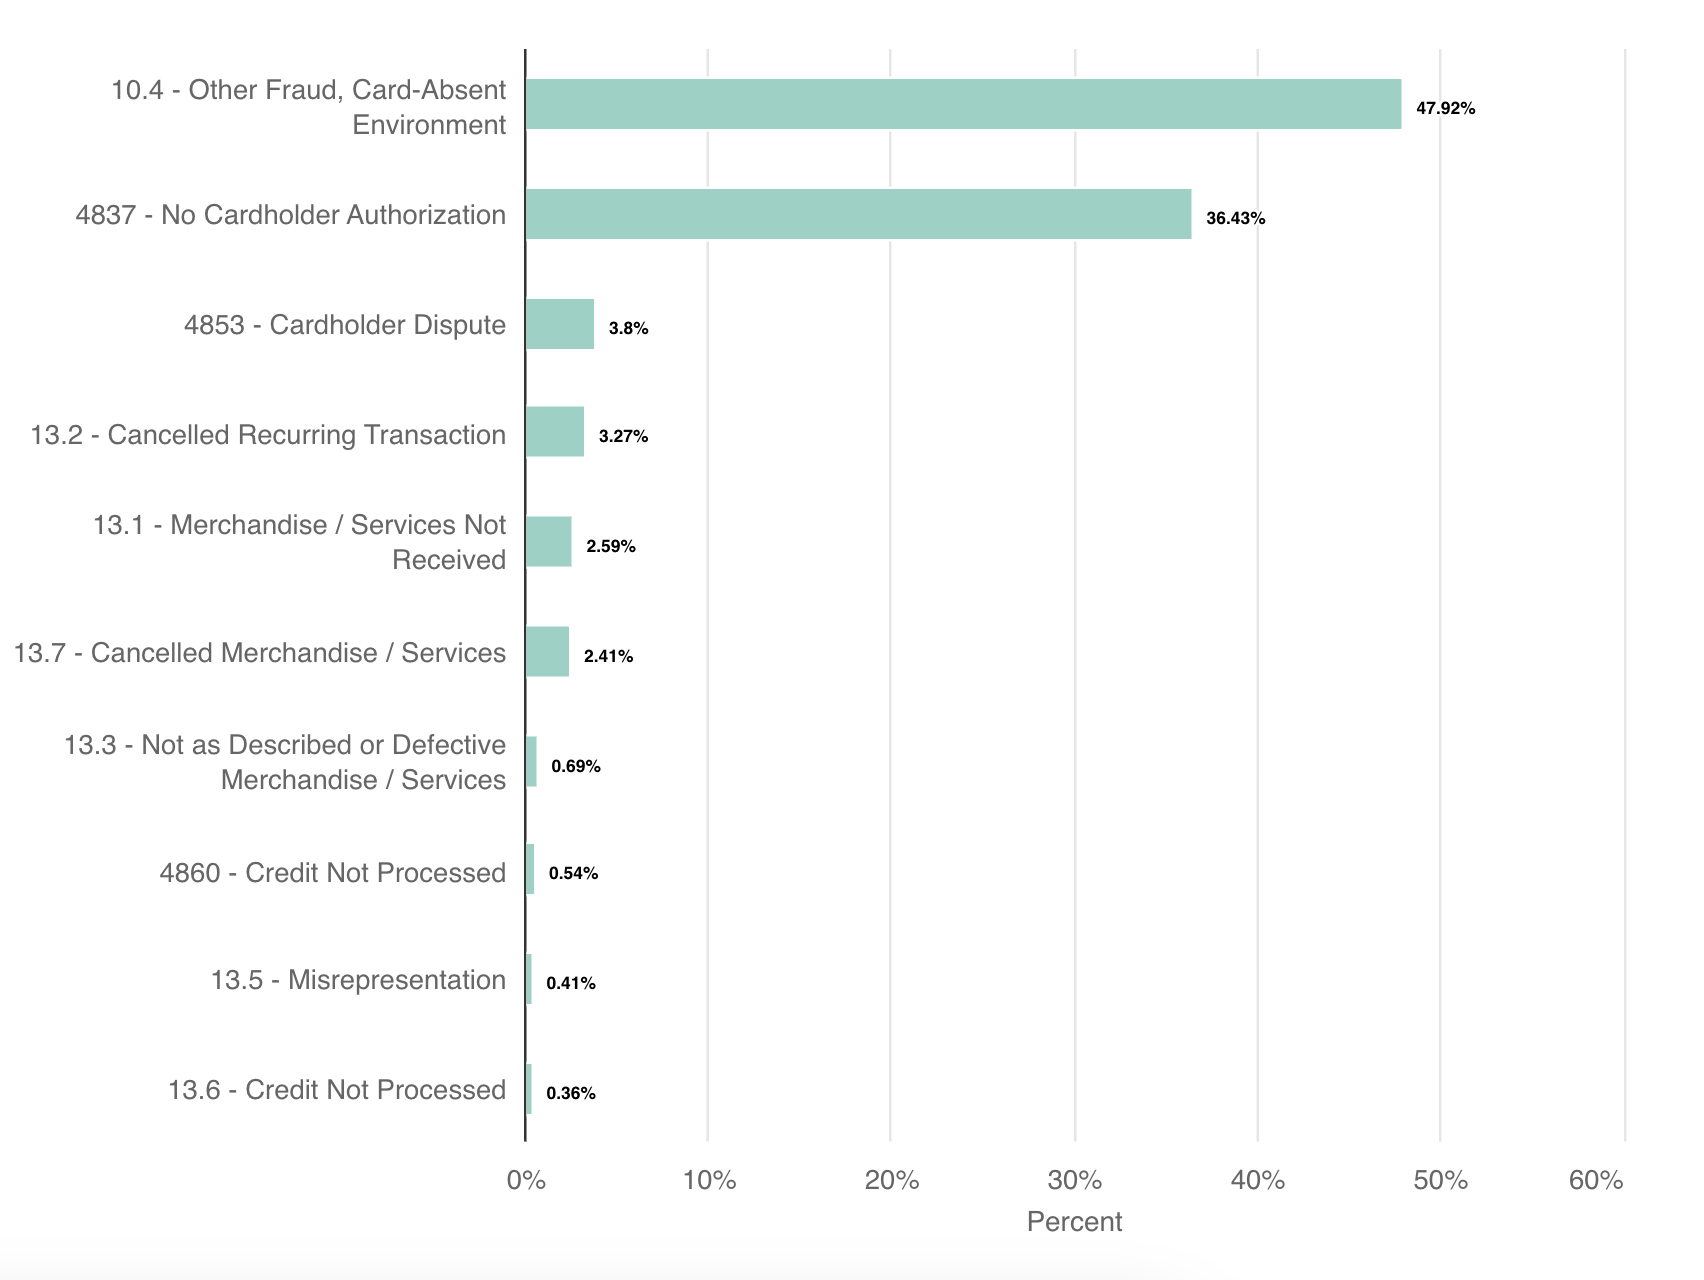
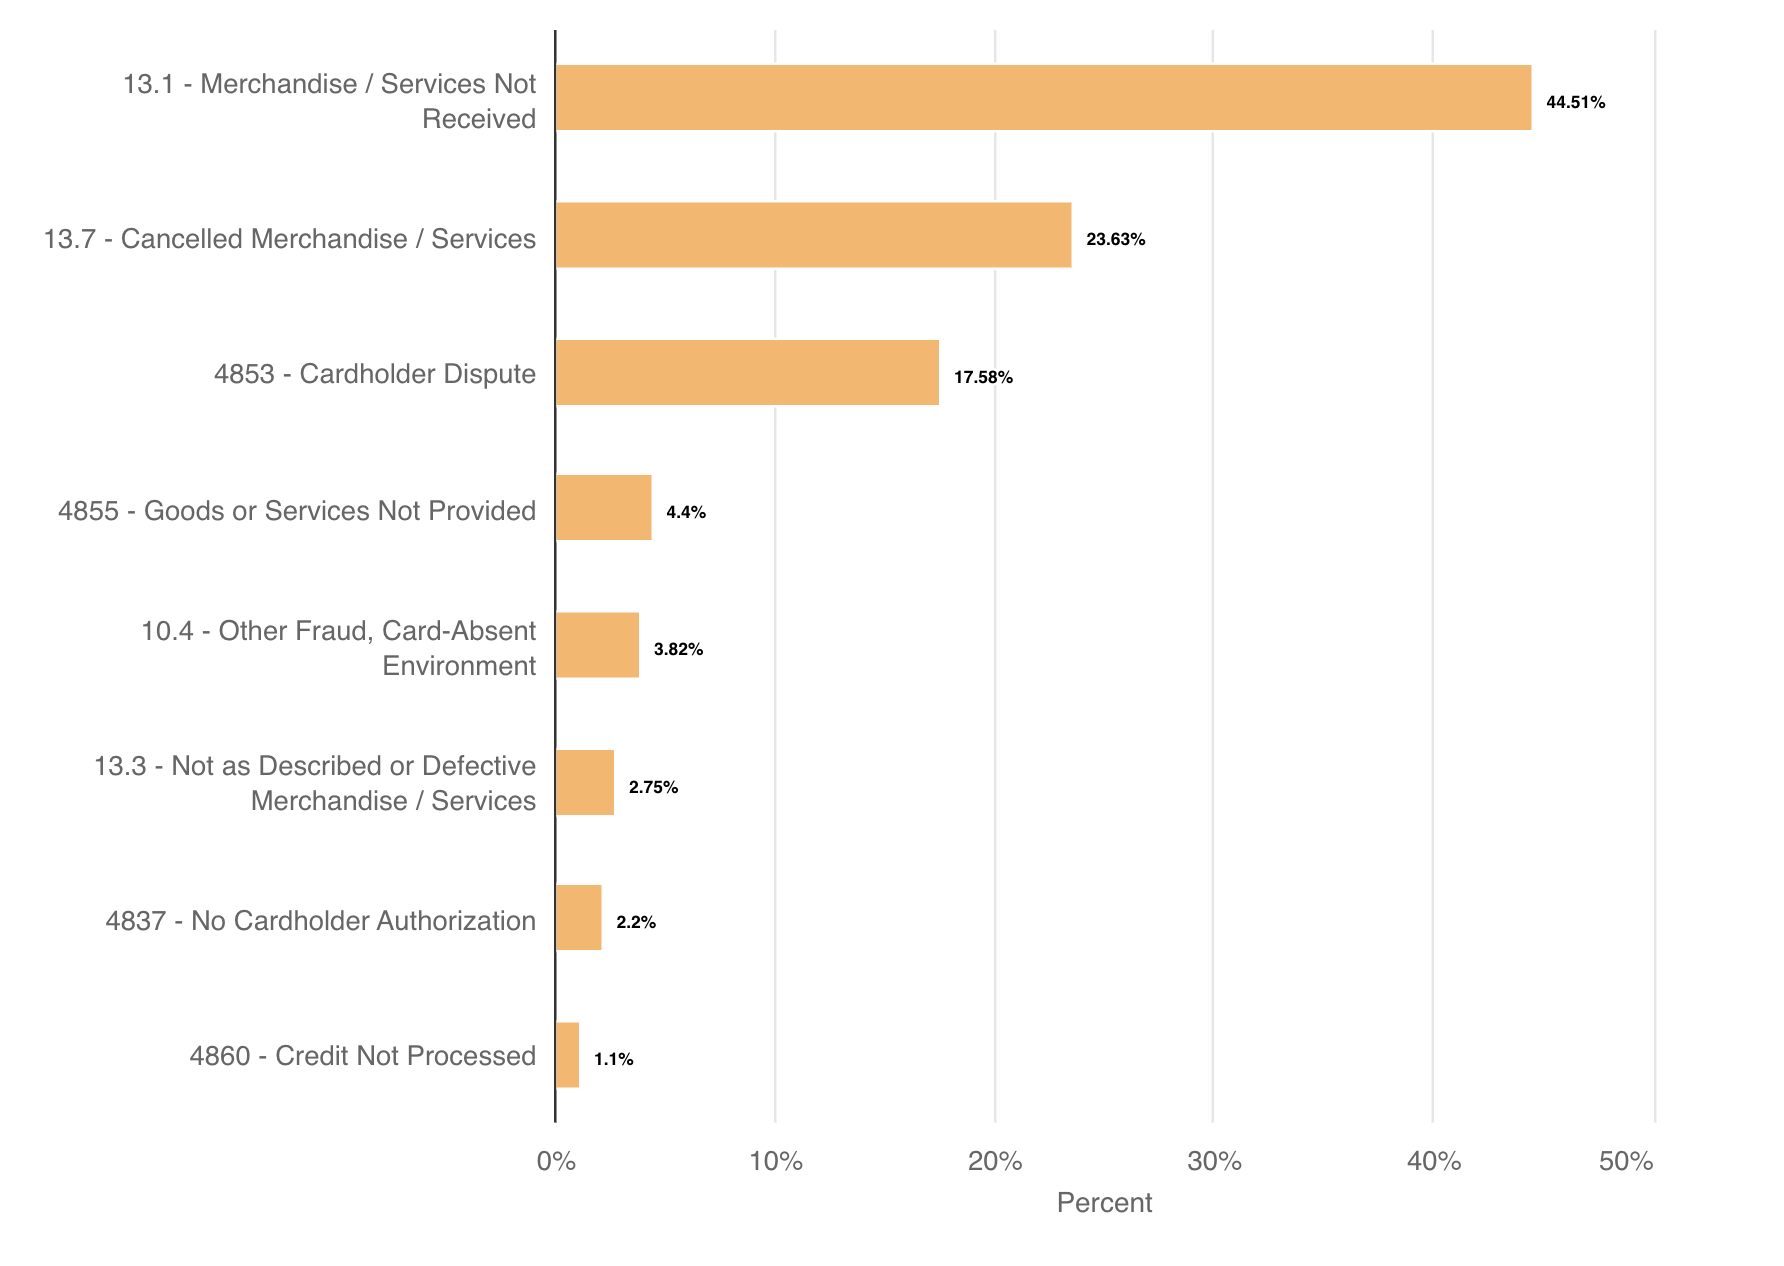
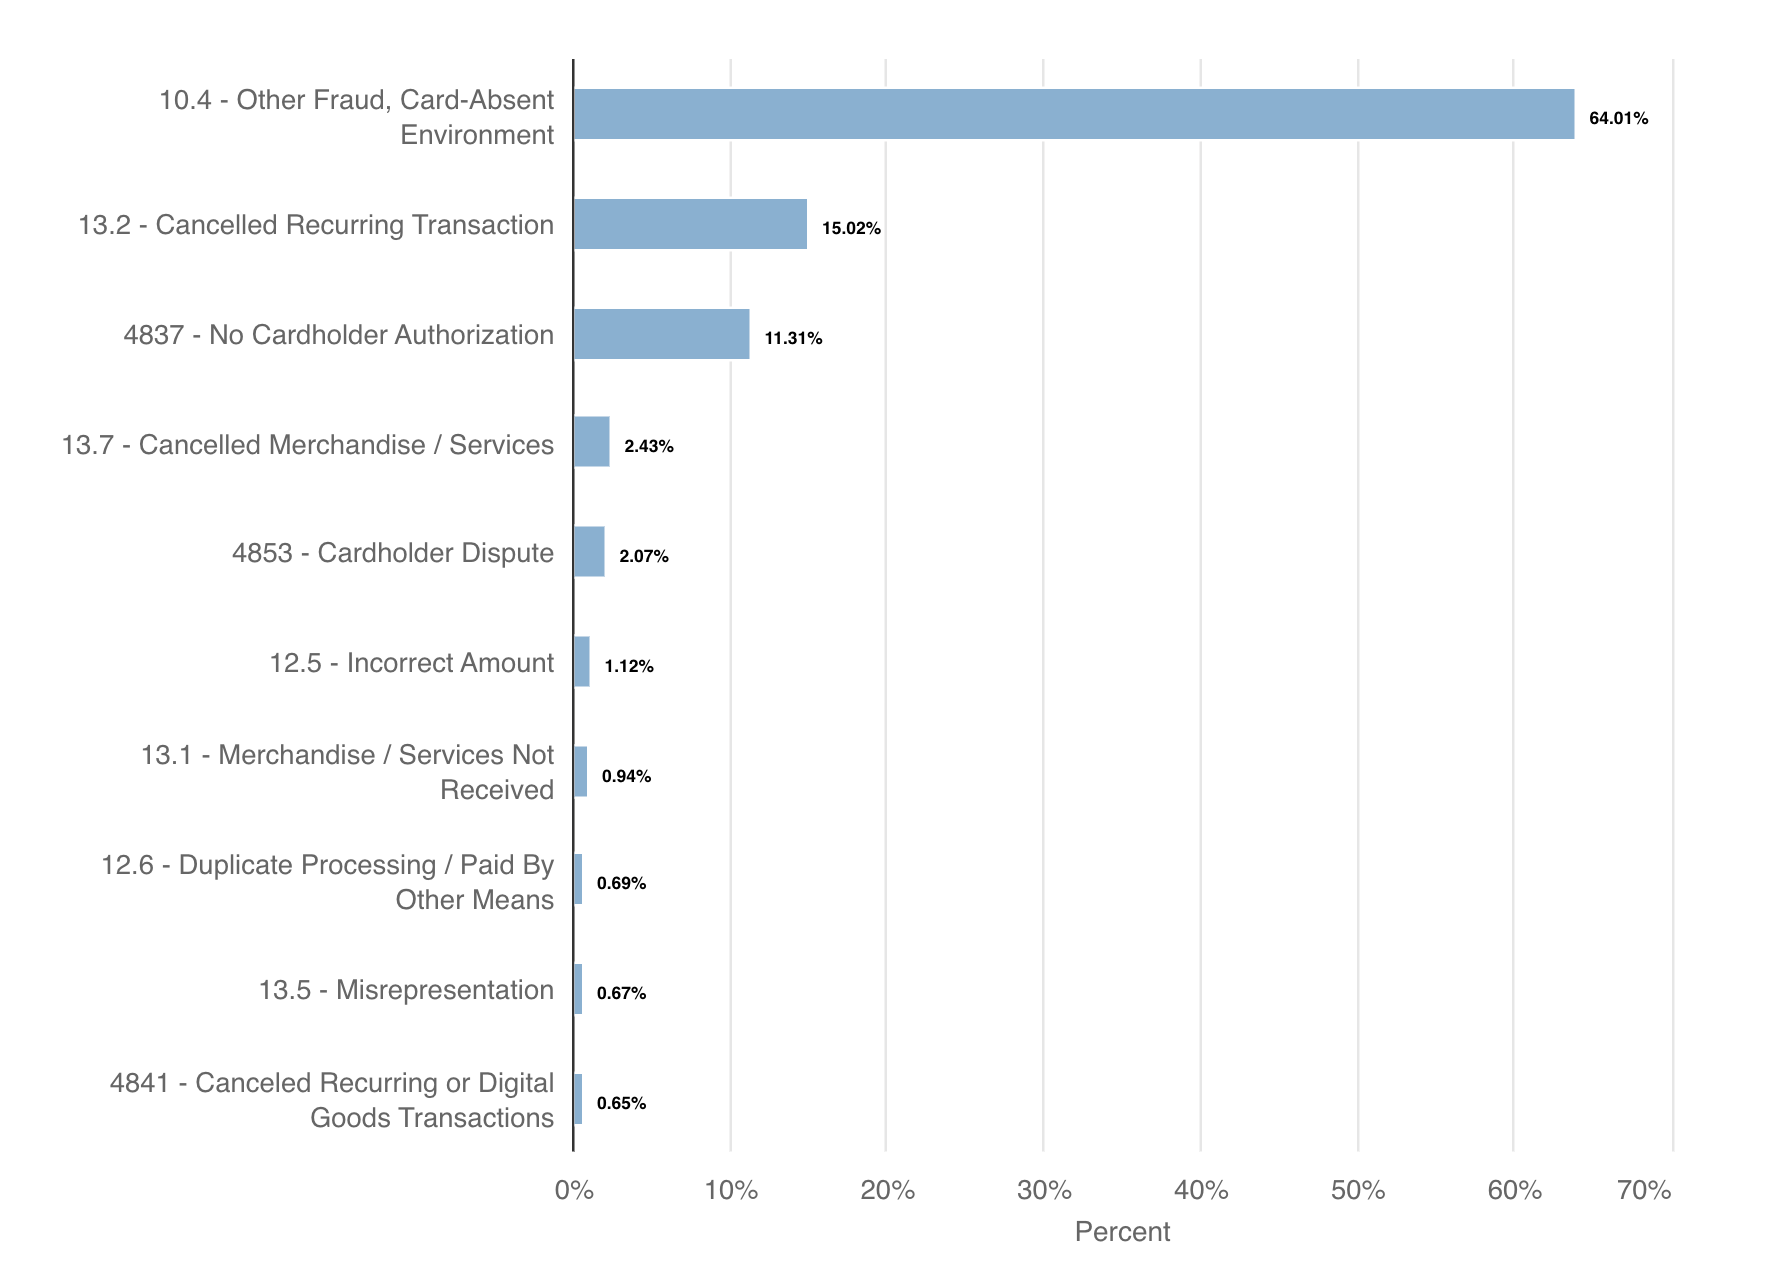
Chargeback trends fluctuate based on the type of item purchased. Reviewing data on the most common Mastercard and Visa reason codes and their average win rates, in conjunction with overall ROI, can help provide greater clarity on what individual businesses can expect.
AVERAGE WIN RATE 72.6% | AVERAGE ROI 777% |
AVERAGE WIN RATE 53.4% | AVERAGE ROI 568% |
AVERAGE WIN RATE 46.8% | AVERAGE ROI 2,285% |
Results by Sales Model
Different sales methods pose different levels of risk. Understanding what’s at stake can help merchants evaluate earning potential as they consider new sales strategies. Available for review are the top Mastercard and Visa reason codes, along with their average win rate and overall ROI.
AVERAGE WIN RATE 49.1% | AVERAGE ROI 436% |
AVERAGE WIN RATE 52.1% | AVERAGE ROI 457% |
AVERAGE WIN RATE 54.5% | AVERAGE ROI 1,182% |
AVERAGE WIN RATE 72.2% | AVERAGE ROI 736% |
Conclusion
The Year in Chargebacks report provides unprecedented insights. The data serves as a valuable benchmark for merchants to evaluate their own individual chargeback management efforts.
If you’d like to achieve the same results as the merchants in this study, Kount can help.
Kount is intelligent chargeback management technology that helps merchants prevent, fight, automate, and analyze chargebacks. Our clients experience better results with greater efficiency and fewer costs. Contact our team of experts today to learn more.